- Solar energy blog
- Introducing new platform UI, financial and comparison tool
Introducing new platform UI, financial and comparison tool


Gabriel Cañadas

At RatedPower we are committed to enabling and empowering our users with the processes and tools that help to optimize their work. With this in mind, we’ve been working on our platform's new interface that looks better, works faster, and is even easier to use than its predecessor in order to improve the user experience of our clients. How are we achieving this?
New Interface
To make RatedPower more visual, all the projects can now be visualized in a map and all the designs in a grid view with an image preview.
To make RatedPower faster, we’ve completely revamped how the web interface communicates with our servers. Now the pages will load faster across the application, especially the projects page.
To make it more intuitive, the different tabs have less texts and more images, making it easier to navigate.
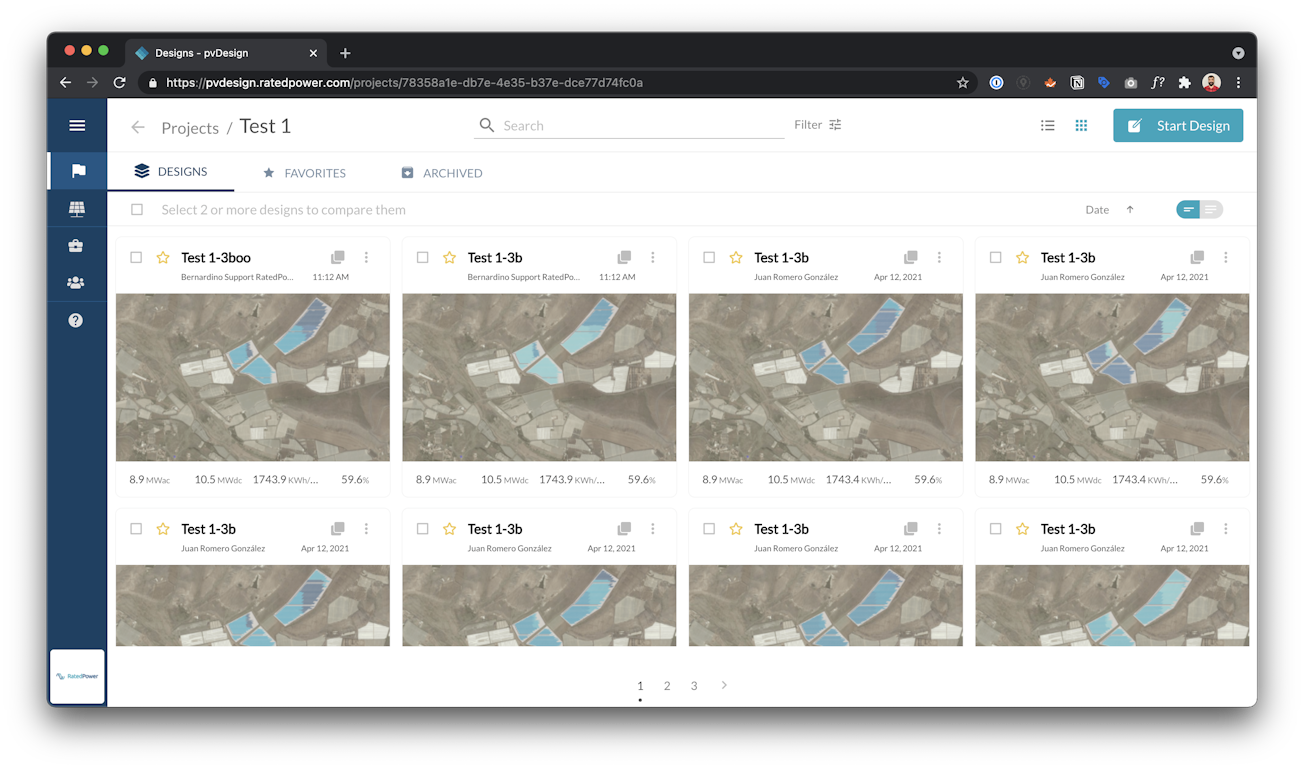
pvDesign new user interface
The new interface will also allow users to organize their projects and designs more efficiently. A search bar has been included as well as a filter to discretize projects and designs by country, number of designs, meteo source used or project creator. In addition, users can now add notes to their designs.
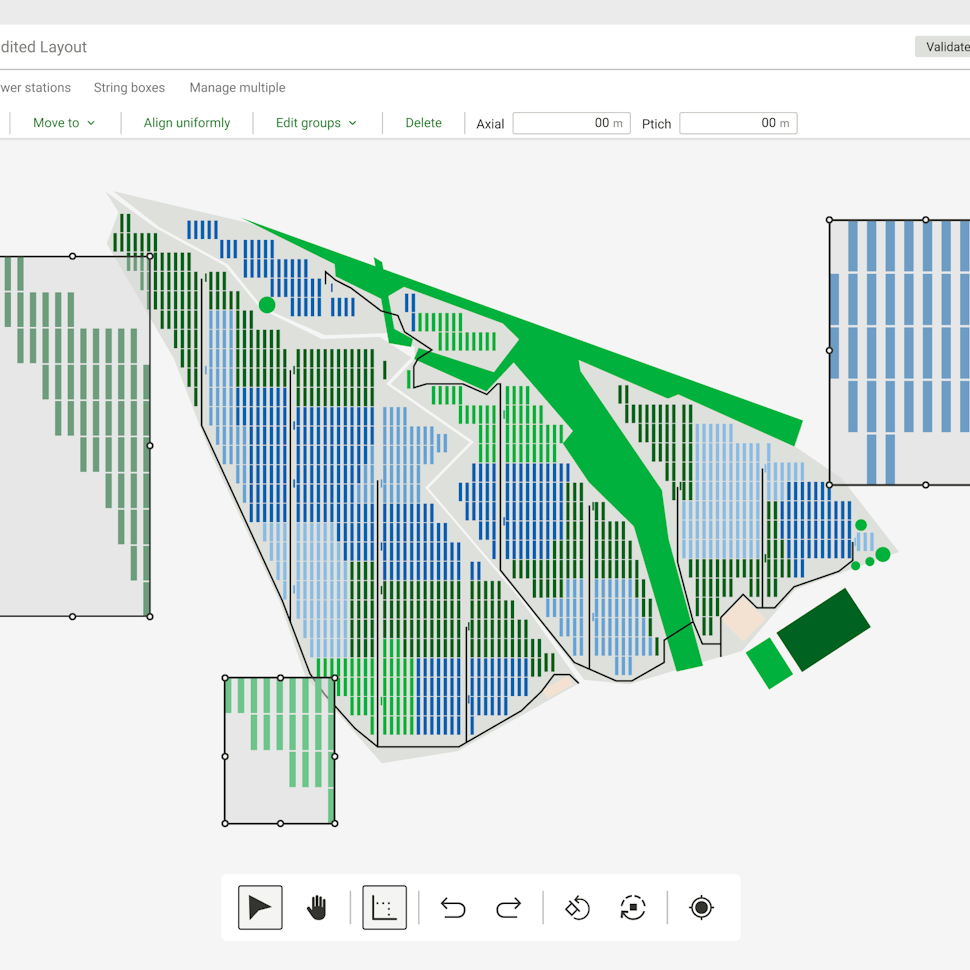
Once a design has been created, it can be analyzed in RatedPower with a bigger map that occupies the full screen and users can select the different layers (LV, MV, trenches, structures, etc.) that they would like to see at the same time.
Financial tool
We have developed an innovative financial tool that has been frequently demanded by our clients in the past in order to allow them to prepare financial estimations much faster and easier. RatedPower can now calculate the CAPEX, OPEX and LCOE of each PV plant design. Users can create cost definition templates, and select them in different simulation scenarios.
As inputs, the price for all of the items, including equipment and civil works, will be needed, as well as the yearly OPEX and the Discount Rate. As outputs, RatedPower will automatically generate a BoQ with the total CAPEX or cost, the specific price or cost per Watt peak and the LCOE or cost per MW hour of a given design.
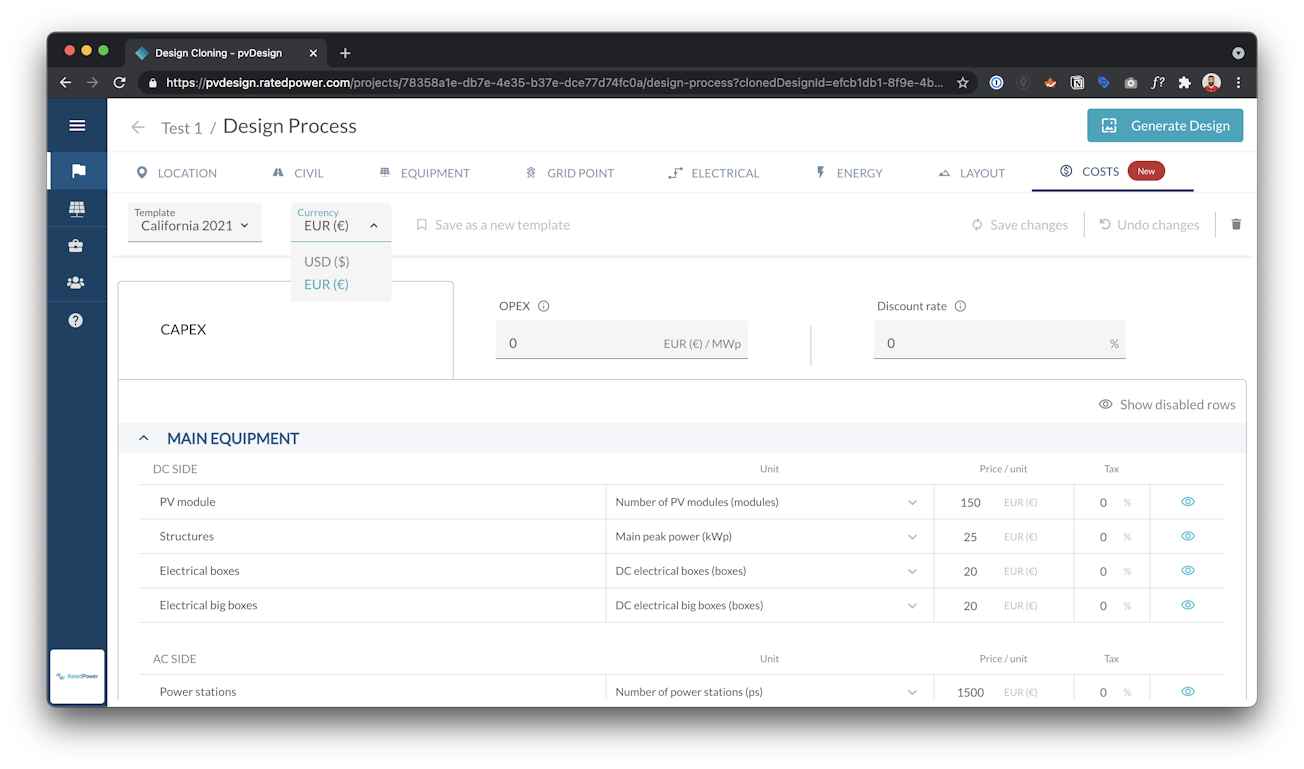
PV plant CAPEX tool available in pvDesign
Comparison tool
Last by not least, If you have different designs for a given project, RatedPower users can now compare any or all of them side by side. For the comparison, users have the option to choose their desired parameters and order them as they will.
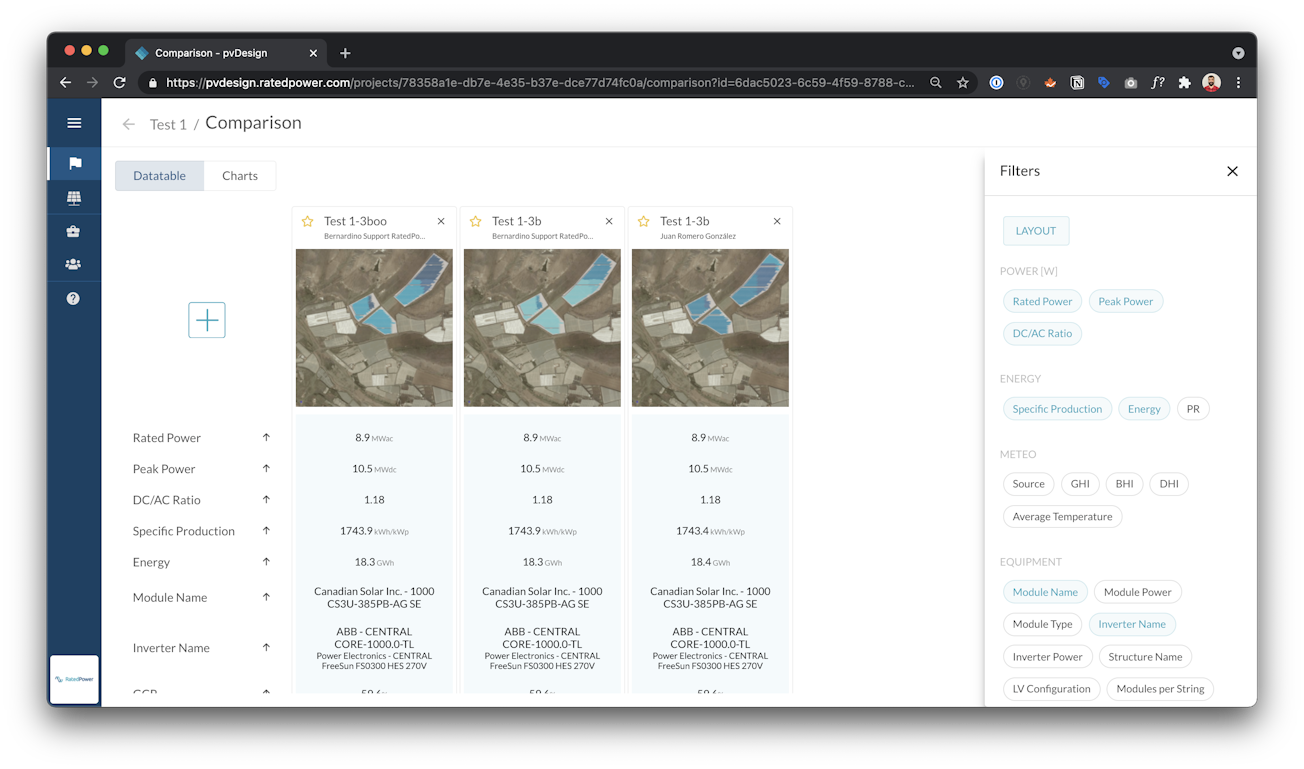
Comparison tool built in pvDesign
All in all, these new interface and latest features will contribute to grow RatedPower’s ecosystem and make our customers’ life easier. This is just another step but we are working hard and 2021 will come full of new developments!
If you want to try our newly developed UI and tools, go ahead and request a demo.
Latest stories
Related posts
Product and corporate updates
Enverus’ Solar ROI calculator: assess PV plant’s profitability
Find out how much you could save by integrating Enverus tools into your solar design workflow, as we explain how our solar ROI calculator works.
Updated 5 AUG, 25

Product and corporate updates
Exploring the RatedPower CAD import tool
Discover the RatedPower CAD import tool, an intuitive and time-saving feature that directly integrates DWG CAD files and shapefiles into our platform.
Updated 17 JUN, 25
Product and corporate updates
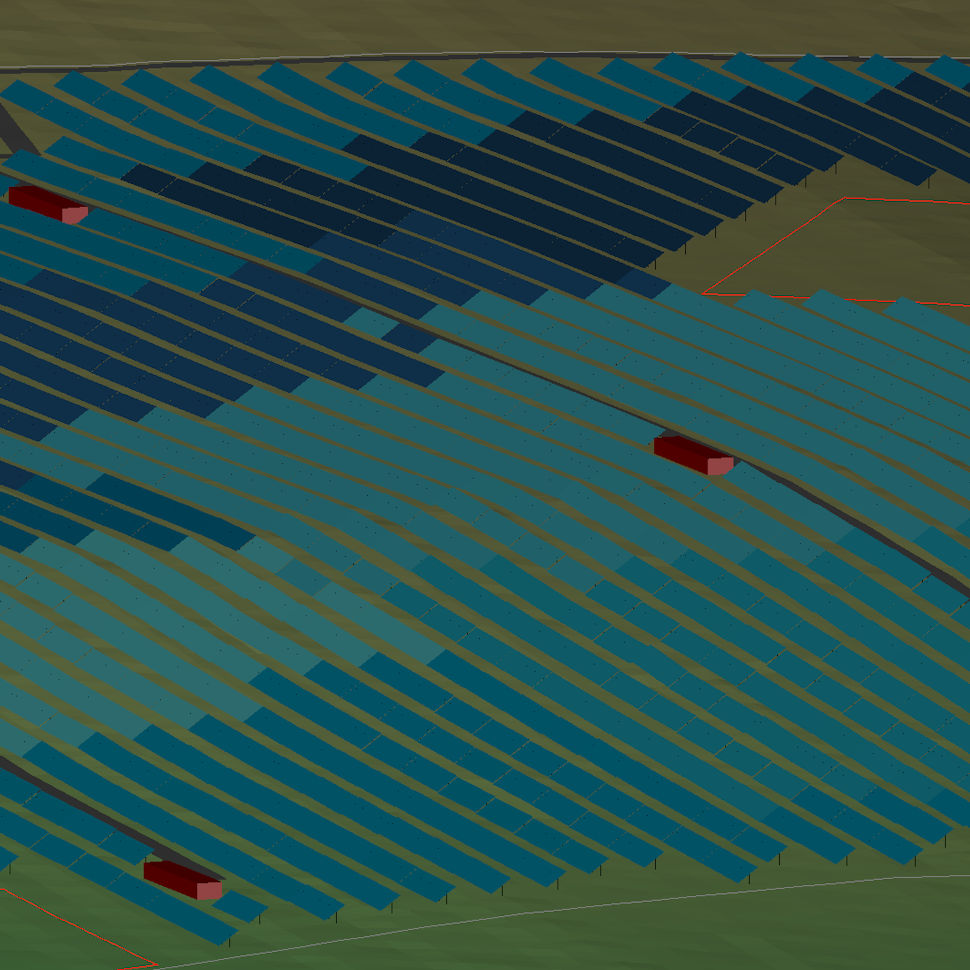
Discover RatedPower’s Layout Editor
RatedPower’s Layout Editor combines precision, automation, and instant feedback to create a financially and commercially viable layout for a PV plant.
Updated 6 MAY, 25
- RatedPower
- Solar energy blog
- Introducing new platform UI, financial and comparison tool
 Watch a demo