Watch a demo
Solar energy in Australia: a 2021 market analysis


Laura Rodríguez
Territory Manager Oceania & Nordics
Laura is a renewable and software industry sales professional, currently working at RatedPower as Territory Manager Oceania & Nordics. With a background in International Business and International Trade, Laura previously worked in the business strategy area in various companies as well as as a market analyst for the Government of Spain in Australia.

Content
According to the International Energy Agency (IEA), at least 627 GW of photovoltaic (PV) are now installed worldwide (115 GW in 2019). As a percentage of global power generation, in 2020 solar contributes almost 3% of the total worldwide. In Australia solar percentage rises to 6.4% of the total (15.9 GW).
Get a comprehensive analysis of the renewable energy in Australia. Download State of Green: Australia.
This success is driven not only due to technology improvements, lower costs, higher efficiencies and the increased social awareness, but also as a consequence of being an adaptive industry that has demonstrated that solar power may be the best solution to overcome a world crisis and Australia is bound to stand out in the process.
Solar in the Australian energy mix
The energy industry in Australia is mainly driven by the importance of coal and natural gas due to the strong mining industry and natural resources in the country.
In 2019, fossil fuels electricity generation in the country accounted to 76% of the total electricity generated, whilst renewable energy represented 24% of the total. However this energy mix is very different depending on the territory.
Data from the Clean Energy Australia Report 2019 shows that Tasmania is the state with the highest penetration of renewables (95.6%) driven by Hydropower. Following Tasmania, South Australia has been another important milestone for renewable´s penetration accounting to 52.1% of total capacity.
On the other hand, in terms of renewable generation, New South Wales and Victoria lead the rankings with 12,160 GWh and 11,428 GWh respectively. In contrast with data of 2018 when total renewable generation reached 48,279 (55,093 GWh in 2019), there has been an increase of 14.1% driven by the states of Queensland and Western Australia that increased their renewable generation 4,064 GWh combined.
Differentiating by technology type of renewable energies, the most developed is the wind power accounting for 35.4% of total renewable energy generated. Wind power is closely followed with solar energies (32.9% of total) including large, medium and short scale installations and by hydro power (25.7%). Lead by the states of Queensland and Western Australia that increased their renewable generation 4,064 GWH combined.
Looking closely into solar data, Australia is a global leader in the photovoltaic sector, not only in large scale systems but also in medium-scale and specially in the small scale sector. In total, according to IRENA, the installed capacity of solar photovoltaic in 2019 was 15.9 GW, which represents an increase of 40.9% since 2018 (11.3 GW).
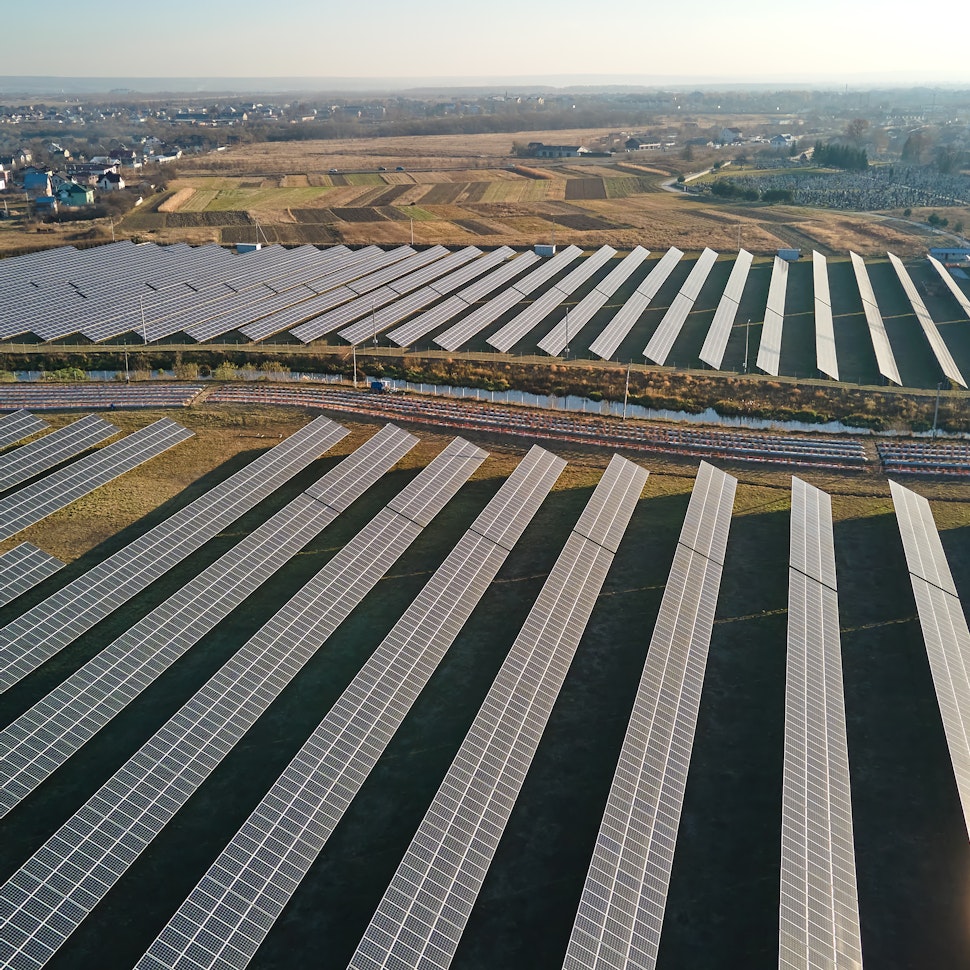
Large scale systems have experienced its biggest momentum in the last couple years increasing the cumulative installed capacity by 791% from 315 MW in 2017 to 2,807 in 2019.
The large-scale solar industry continued its momentum in 2019, with 27 new projects adding 1416 MW of new capacity. This almost doubled the industry’s total capacity in Australia, which is now over 2.8 GW, and its contribution to Australia’s renewable energy generation increased from 3.9% in 2018 to 9.3% in 2019.
Driving investment in renewable energy in Australia
Investment in renewable energy generation has been increasing markedly in Australia over the last years, driven by a combination of factors including government policy incentives, elevated electricity prices and declining costs of renewable generation technology.
Over the past decade, the share of electricity generation from renewable sources has increased steadily to be 24% per cent in 2019 (a 20% increase compared to data of 2018). For a brief period, in November 2019, renewables passed the 50% mark of total generation in the National Electricity Market (NEM) and in March 2020, this milestone was not only achieved in the NEM but also on a national scale combining all grid systems.
In 2019, there were 92 large-scale solar or hybrid projects across Australia, of which 66 are under construction or financially committed and 27 finalised during 2019. Only in 2019, large-scale solar projects accounted for the creation of 19,225 jobs for the construction of 13,269 MW solar plants for a total of 24.9 billion Australian dollars.
Solar energy in Australia outlook
Despite the high investments in the sector that have led to continuous growth of the industry, recent changes to government policies as well as the bottlenecks when connecting new sources to the NEM electricity grid have lowered the growth expectations on investment in renewable energies in the near term.
Nevertheless, over the longer term, the transition towards renewable energy generation is expected to continue, as ageing coal-powered stations are retiring and the process of decarbonisation continues and the rising maintenance costs.
Before the Covid-19 world crisis, industry revenue was forecasted to increase at an annualised 18.1% over the following five years according to Ibisworld, to reach $1.3 billion. Nevertheless, in spite of this situation, global markets expect renewable energies to be the motor of the economic recovery.
Learn the role of renewables in the post-COVID economy. Get your free report.
Looking into updated information on large-scale projects during the first 4 months of the year, it's clear that the number of projects reaching financial close is similar in comparison to 2019.
All in all, in order for the industry to continue its growth, experts believe that the sector should now focus on achieving higher efficiencies when developing solar projects. This would be achieved by combining digitalisation, such as softwares for efficient engineering processes, with other technologies like energy storage or bifacial solar panels.
Several reports, such as the IEA’s Trends in Photovoltaic Applications 2020 or Solar Power Europe with data from 2019, positioned Australia as a World Leader in Solar Energy.
Get a comprehensive overview of the renewable industry in Australia. Download your free report.
Australia has for some years experienced a fast and massive photovoltaic development growth. If initially it started in rooftop applications, especially in the residential segment, it then shifted quite rapidly to utility-scale applications which were in 2019 massively developed.
As a reference, large-scale solar farm development increased industry generation from less than 500 GWh in 2016 to over 5,500 GWh in 2020, 10x times more.
In 2019, Australia ranked first on World’s highest solar capacity per capita with a total of 644 Watt/capita. This value is not surprising since only residential solar installations accounted for more than 5% of total energy generation capacity and +22% in terms of renewable energy. This is equivalent to +2.5 million households.

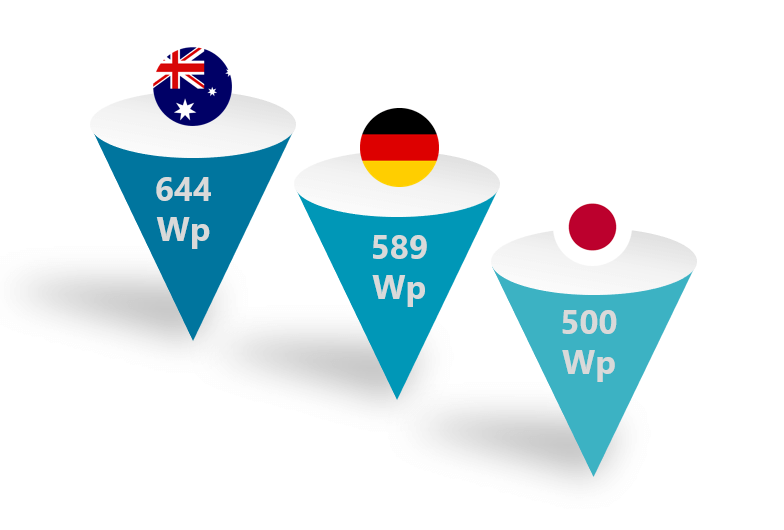
Australia leading the renewable energy installed capacity per capita ranking (Source: IEA)
As for new photovoltaic installations, Australia was ranked No.6 in the world for installing 5 GW in 2019, a feat the IEA described as a “tremendous level given the country’s population”.
Australia ranked No.7 overall for total installed PV with 15.9 GW by the end of 2019. Additionally, the Australian PV Institute (APVI) revealed that the nation was on track to install more than 4 GW of new PV capacity in 2020, for a cumulative total of more than 20 GW.
On another note, battery storage was highlighted as another key market element with the IEA rating Australia as the most mature market, with 2.7 GWh installed by the end of 2019.
Can we expect these rankings for 2021?
Although there aren’t any official rankings yet that evaluate homogeneously the solar industry in the markets, we have gathered several information from some of the countries with higher growth expectations and with published data.
Despite COVID-19, according to BloombergNEF as much as 194GW of solar PV could be installed globally this year. Predictions of Solar Power Europe expected Australia to reach a compound annual growth rate of 20% however, what has happened in other countries?

Total renewable capacity and perspectives
BNEF states that although established markets like the US and China represented the majority of renewables investment, data suggests that European nations, particularly Germany, the UK, France, the Netherlands, and Spain, drove much of the growth in energy transition funding last year.
In data, investment in European renewables rose 67% last year compared with 2019.
According to Reuters, China solar capacity growth hit 40 GW in 2020.
The United States saw an increase of 43% of solar installations reaching a record of 19 GW according to the SEIA.
Japan grew annual solar PV Capacity by 17% to reach around 8.2 GW of new installed capacity and reaching a cumulative of 71,7 GW.
In Europe, Spanish media has reported an addition of 2.4 GW of new solar capacity.
Australia hasn’t publicly announced data from 2020 nevertheless, according to SunWiz, rooftop solar installations reached a record of 13 GW of cumulative capacity (+3 GW increase). On the other hand, utility-scale projects only added 786 MW of installed capacity to the grid in accordance with data by the Clean Energy Council.
Although one could argue that 2020 has been a really complicated year for every industry and market, Australia hasn’t been more affected than other market leaders such as China, the US or Japan.
The reasoning behind might be that rather than paralyzing the growth of the industry, other markets have made the proliferation of renewables a key strategy on their roadmap for the next few years. As we have seen in several reports and on our ebook “Stepping into a Post-COVID Economy. How Renewable Energy and Photovoltaics Will Play an Essential Role in its Recovery”, solar will play a major role in the recovery of the economy.
Will Australia be able to channel investment and encourage the solar industry as World Leaders are doing? What do you believe?
We will keep ourselves and yourself informed on the matter. If you want to learn a bit more of the Australian Solar Industry, we encourage you to explore our latest Ebook: The State of Green 2021 in Australia.
2026 Trends: Renewable Energy & Solar Research Report
Get key insights and data from an industry-wide survey and solar simulations on the RatedPower platform. Download now to uncover critical trends and challenges shaping the future of renewables.

Latest stories
Related posts
Market analysis
Solar PV & the german grid: a pre-validation guide
Improve solar interconnection approval odds in Germany. PRISM screens grid capacity; RatedPower produces the permit-ready documentation operators expect.
Updated 28 JUL, 26


Market analysis
India's 44.5 GW year: why deployment speed is raising the bar for design discipline
India's 44.5 GW year is reshaping solar project design. Lenders are raising the bar on documentation and traceability. Here's what that means for your project.
Updated 21 JUL, 26


Market analysis
Türkiye's solar boom is outpacing its grid: what that means for project design
Türkiye doubled its solar capacity in 30 months and has 14.6 GW more coming. Here's how to design solar projects that hold up when grid constraints and clipping compound.
Updated 14 JUL, 26