Watch a demo
Breaking down solar farm costs: Free template inside


Laura Rodríguez
Territory Manager Oceania & Nordics
Laura is a renewable and software industry sales professional, currently working at RatedPower as Territory Manager Oceania & Nordics. With a background in International Business and International Trade, Laura previously worked in the business strategy area in various companies as well as as a market analyst for the Government of Spain in Australia.

Content
We have already discussed all key trends such as bifacial modules, floating solar and the photovoltaic recycling challenge. However, have you ever wondered what the average cost of a solar farm is in your country? And worldwide? What costs represent the higher percentage in your accounts and, more importantly, how could we decrease these costs.
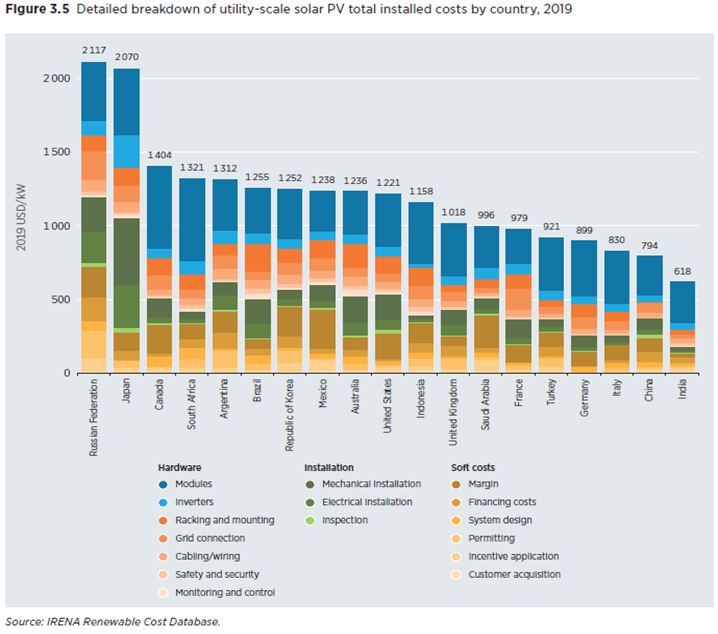
Well, lets begin examining an impressive research paper carried out by IRENA on renewable power generation costs. According to IRENA, the country average for the total installed costs of utility scale solar PV in the studied countries ranged from a low of USD 618/kW in India to a high of USD 2,117/kW in the Russian Federation in 2019. Comparing them, the highest solar farm cost average was about x3.5 more than the lowest, despite the convergence of installed costs in major markets in recent years. The average total installed costs was USD 1191.5/kW.

Take off the hassle of having your PV plant costs on track. Hijack this bill of quantities template for free. +1,000 solar engineers are saving time with it. Download it now
Types of costs on a solar plant
The balance of system (BoS) costs can be broken down into three broad categories: non-module and inverter hardware, installation costs, and soft costs. These three categories can be broken down in more detailed sub-categories.
Non-module hardware costs
Cabling
All direct current (DC) components, such as DC cables, connectors and DC combiner boxes
All AC low voltage components, such as cables, connectors and AC combiner boxes
Racking and mounting
Complete mounting system including ramming profiles, foundations and all material for assembling
All material necessary for mounting the inverter and all type of combiner boxes
Safety and security
Fences
Camera and security system
All equipment fixed installed as theft and/or fire protection
Grid connection
All medium voltage cables and connectors
Switch g ears and control boards
Transformers and/or transformer stations
Substation and housing
Meter(s)
Monitoring and control
Monitoring system
Meteorological system ( e.g., irradiation and temperature sensor)
Supervisory control and data system
Installation costs
Mechanical installation (construction)
Access and internal roads
Preparation for cable routing ( e.g., cable trench, cable trunking system)
Installation of mounting/racking system
Installation of solar modules and inverters
Installation of grid connection components
Uploading and transport of components/equipment
Electrical installation
DC installation ( module interconnection and DC cabling)
AC medium voltage installation
Installation of monitoring and control system
Electrical tests ( e.g., DC string measurement)
Inspection (construction supervision)
Construction supervision
Health and safety inspections
Operations and maintenance (OM costs)
Operations and maintenance, usually found as O&M, costs includes all the expenditure categories since the beginning of PV plant operations. Examples of them are PV module cleaning, monitoring or on-site inspections.

How hard is getting your solar LCOE low and your ROI high. This bill of quantities template is saving a tonne of time to +1,000 solar engineers worldwide. Download it now.
Soft costs
Incentive application
All costs related to compliance in order to benefit from support policies
Permitting
All costs for permits necessary for developing, construction and operation
All costs related to environmental regulations
System design
Costs for ecological surveys or structural analysis
Costs for surveyors
Costs for conceptual and detailed design
Costs for preparation of documentation
Customer acquisition
Costs for project rights, if any
Any type of provision paid to get project and/or off-take agreements in place
Financing costs
All financing costs necessary for development and construction o f PV system, such as costs for construction finance
Margin
Margin for EPC company and/or for project developer for redevelopment and construction o f PV system includes profit, wages, finance, customer service, legal, human resources, rent, office supplies, purchased corporate professional services and vehicle fees
We know that costs for electricity generated from new solar PV farms has fallen 82% since 2010. The levelized cost of energy generated by large scale solar plants is around USD 0.068/kWh, compared to USD $0.378 ten years ago. However, what is interesting to see is that these cost reductions were led by hardware components, with modules and inverters accounting for 62% of the global weighted-average total installed cost decline between 2010 and 2019.
Balance of systems costs costs are therefore an important contributor to the declining global weighted-average total installed costs, with 13% of the global reduction coming from lower installation costs, 7% from racking, 3% from other BoS hardware (e.g., cables, junction boxes, etc.) and 15% from a range of smaller categories.
Taking a closer look at the data obtained from IRENA, we can draw the next indicators:
Although modules on average mean 30% of total installation costs (USD 357.9/kW), in some countries these prices might be quite different. In South Africa for instance, on average these costs may reach up to USD 557/kW which would account to 42.2% of total plant costs.
On another note, installation costs might also see an important deviation from the average depending on the country. Japan has the highest mechanical installation costs (USD 456.2/kW and 22% of costs) which is more than double the average costs worldwide ((USD 119/kW, 10% of plant’s costs). On the other side of the balance, Indonesia’s mechanical and electrical installation costs only sum up to (USD 41.5/kW and 3.6% of total costs of the plant) in comparison to a x4 times world average of (USD 187.7/kW, 15.8% of costs). This sheds light on Indonesia’s low labor costs.
Last but not least, it is also interesting to compare the margin costs between countries, which might go from (USD 260.9/kW) in the case of Mexico to as little as (USD 25.6/kW) in Indonesia being the world average (USD 132.9/kW).
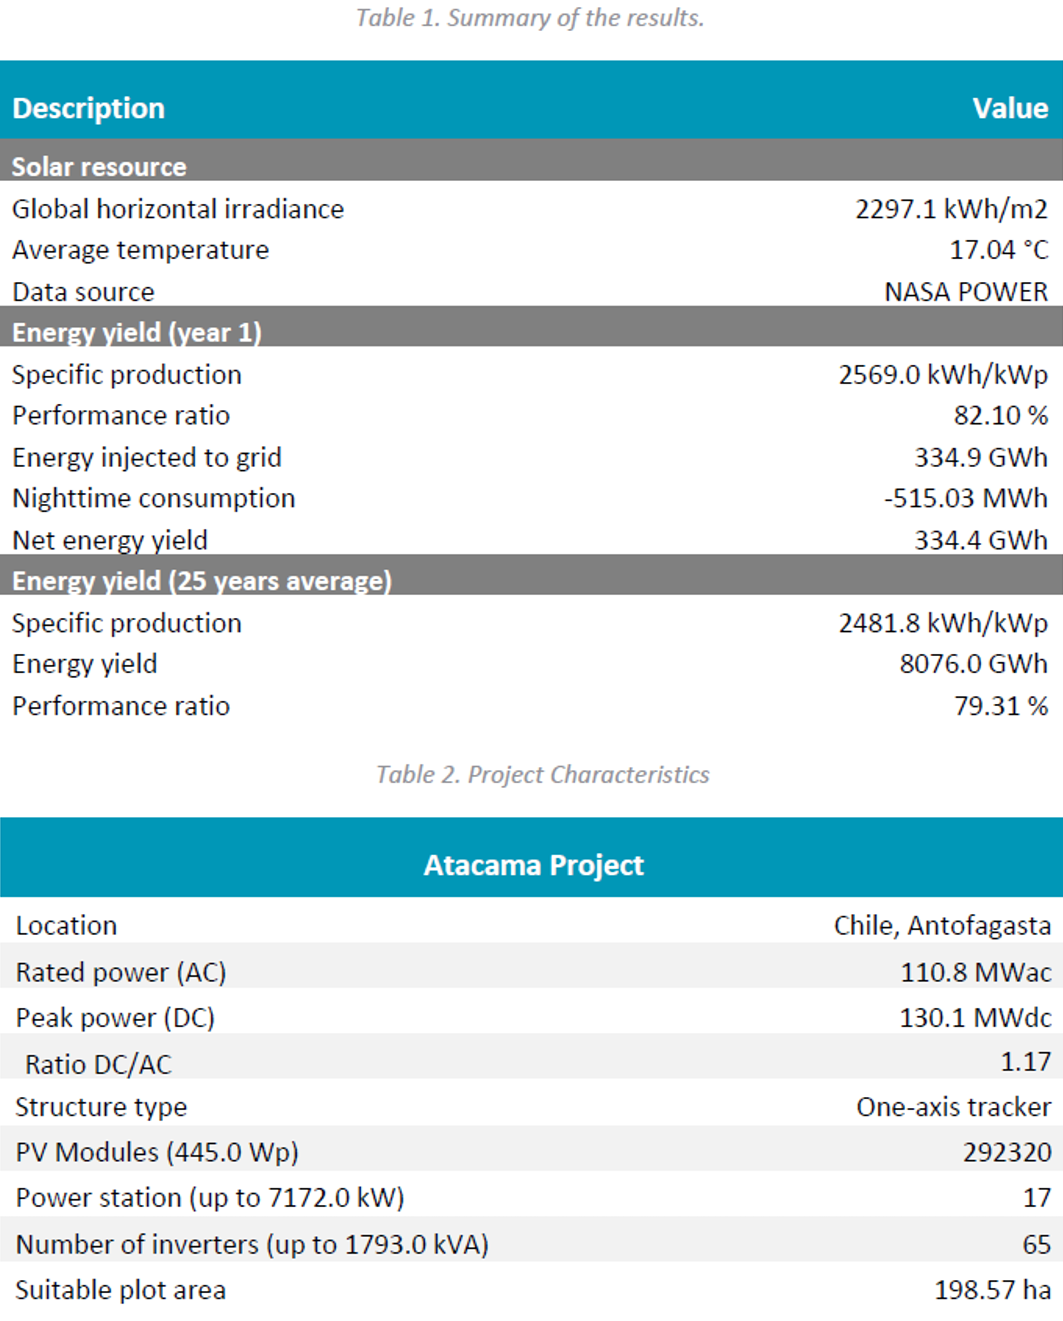
Allocate your costs efficiently: a real case study

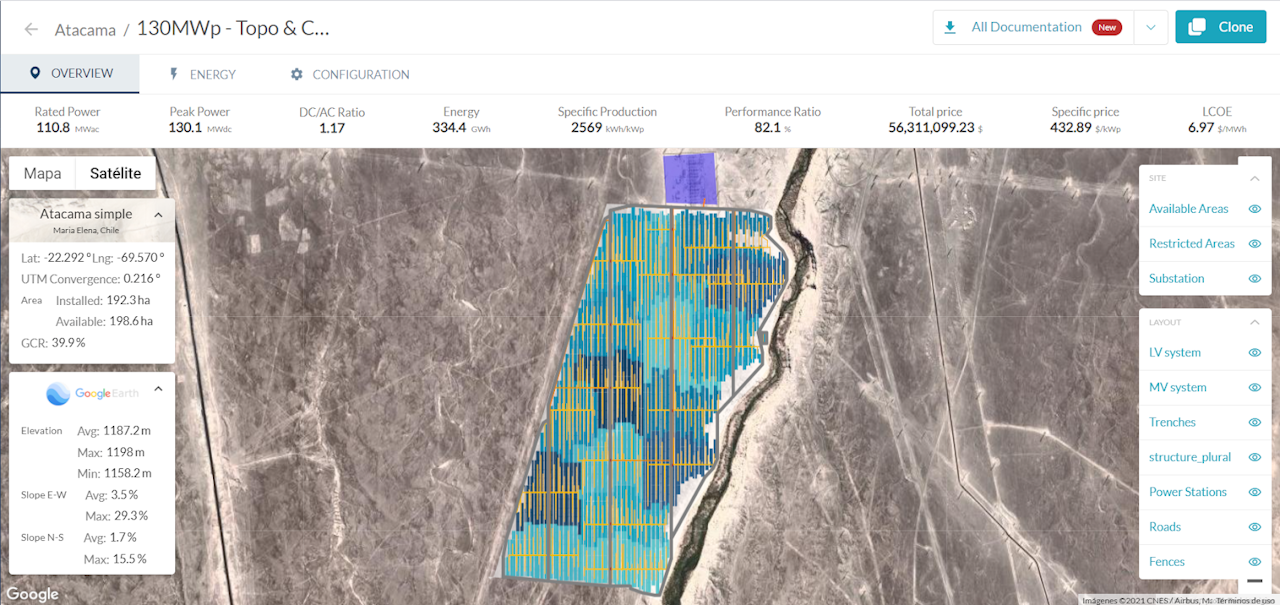
Download our BoQ for the direct costs of this project (by putting their data) to understand in a real case scenario how the different equipment quantities and unitary prices affect your plant’s LCOE. Download it now.
Feel free to use our spreadsheet as a template and play around with the different items that form a solar farm: modules, inverters, power stations, trenches, manholes, roads, different types of cables and even miscellaneous things such as surveillance cameras.

Using data, planning and embracing technology are key to decreasing costs
Solar has been the renewable energy with the greatest cost reduction of the last decade. The reasons for this can be summarized mainly in: competitive pressures, greater installer experience, the spread of best practice installation and soft costs, module efficiency improvements and digitalization.
Nevertheless, although these reasons explain the reduction of costs until now, if the curve is to keep its path downward, investing in digitalization and AI technologies is a must.
It is clear that costs may vary vastly depending on your location and the conditions of the plant. However, what we must prioritize is always providing the most accurate preliminary design based on known historical data, to properly plan the project ahead and avoid unexpected costs.
How can we do that?
Technology.

Did you know that recent study by Inderwildi et al. (2020), estimates that digitalisation has the potential to increase carbon abatement by 20%?
Let us introduce RatedPower, a solar modeling tool, that will allow you to perform different simulations to thoroughly analyze the feasibility of different projects, locations and equipment, while optimizing the layout of your solar photovoltaic projects and then obtaining +300 pages of documentation for planning and financial analysis. Watch our introductory video for further information and don’t hesitate to contact us!

Free BoQ template: Get your solar power plant costs on track
Having your PV plant costs on track is a hard task. Reduce the hassle with this comprehensive template with with 70+ items.


Latest stories
Related posts
Market analysis
Solar PV & the german grid: a pre-validation guide
Improve solar interconnection approval odds in Germany. PRISM screens grid capacity; RatedPower produces the permit-ready documentation operators expect.
Updated 28 JUL, 26


Market analysis
India's 44.5 GW year: why deployment speed is raising the bar for design discipline
India's 44.5 GW year is reshaping solar project design. Lenders are raising the bar on documentation and traceability. Here's what that means for your project.
Updated 21 JUL, 26


Market analysis
Türkiye's solar boom is outpacing its grid: what that means for project design
Türkiye doubled its solar capacity in 30 months and has 14.6 GW more coming. Here's how to design solar projects that hold up when grid constraints and clipping compound.
Updated 14 JUL, 26