Watch a demo
Solar energy in US: a 2020 market analysis


Gabriel Cañadas


During 2019 the U.S. installed 13.3 GW (+23% YoY) of solar PV capacity, of which 8.4 GW were utility-scale (+37% YoY and representing 63% of the total PV installed), to reach a total of 77.7 GW installed capacity. Community solar continues to expand its geographic diversification experiencing a third consecutive year of more than 500 MW installed.
Solar in the United States energy mix
According to the U.S. Energy Information Administration (EIA), in 2019 renewable energy accounted for about 11% of total U.S. primary energy consumption, 9% of which came from solar, representing 1% of the U.S. total energy consumption. On the generation side, solar energy grew from representing 1.4% of all utility-scale electricity generation in 2018 to 1.8% in 2019. This increment was due to the 15.9% growth of the solar PV generation during 2019.
Learn the role of renewables in the post-COVID economy. Get your free report.
Specifically, utility-scale generation increased by 14.6% and represented 66.3% of the total PV generation, 99% was generated by the electric power sector, of which 90.5% came from IPPs (+12,8% YoY) and 9.5% from electric utilities (+34% YoY).
By state, during 2019 California generated the most (38.2% of the total), followed by North Carolina (10.6%), Nevada (6.8%), Texas and Arizona (6.3%) and Florida (5.6%). The greatest expansion was in California (+1,856 GWh), Florida (+1,520 GWh), North Carolina (+1,182 GWh), Texas (+1,115 GWh), Minnesota (471 GWh) and New York (+353 GWh).
Driving Investment
Developments have been boosted by different programs. The most remarkable is the Investment Tax Credit (ITC), a reduction in the income taxes that companies pay based on the amount of investment in solar property. If construction was to begin during 2020 this reduction would be 26%, 22% if it began in 2021, and 10% permanently after this year for utility projects. Furthermore, it is more than likely that this ITC will be extended, due to the introduction of the ‘Moving Forward Act’. According to Wood Mackenzie, if the ITC was to be extended until 2030 at 30%, the United States would install 82 additional GW
The Renewable Energy Standards (RES) are also important. These standards require, depending on the state, utility companies to source a certain amount of the energy they generate from renewable sources or even incentivise the deployment of particular market segments or energy technologies.

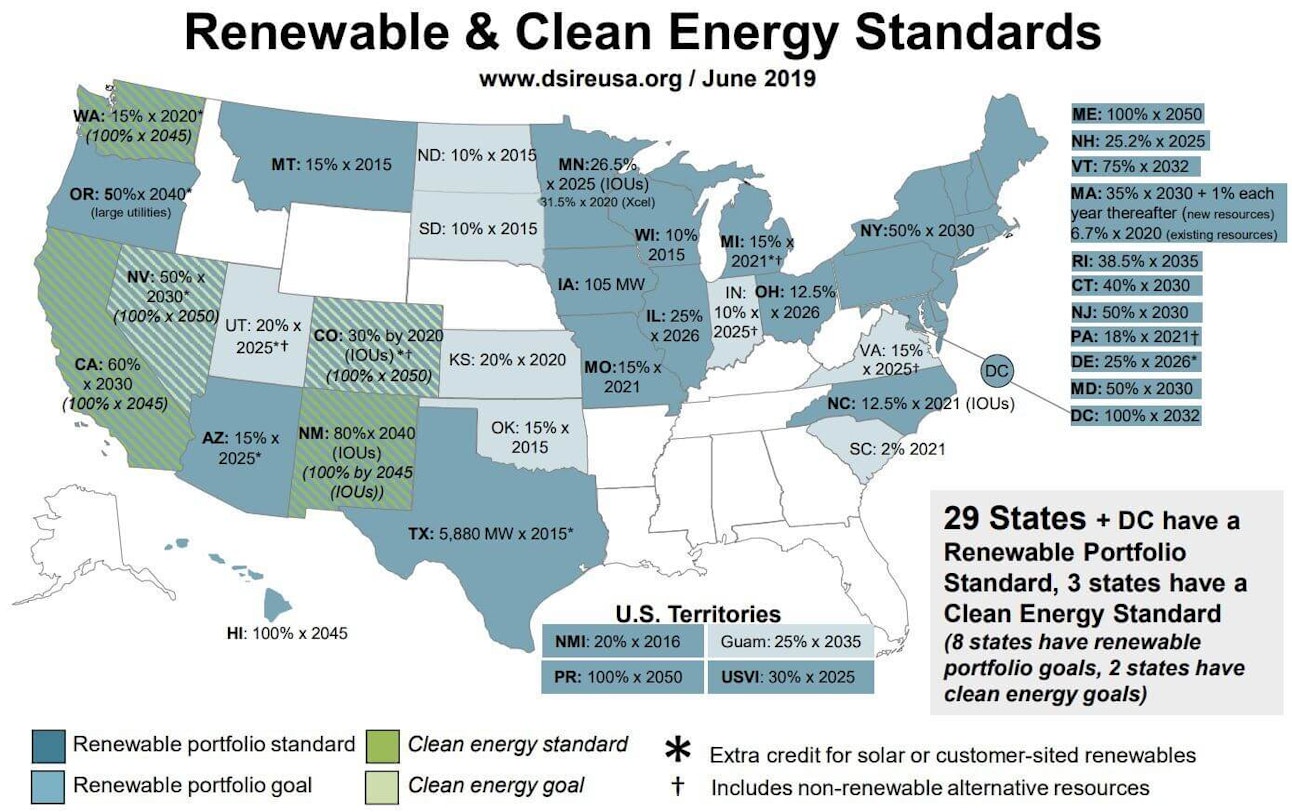
Renewable and Clean Energy Standards (Source: DSIRE, N.C. Clean Energy Technology Center)
Industry outlook
According to SEIA and Wood Mackenzie “US Solar Market Insight Report” solar PV accounted for nearly 40% of all new electricity-generating capacity additions in 2019, installing 13.3 GW (+23% YoY), 8.4 GW was utility-scale (+37% YoY and 63% of the total PV installed), to reach 77.7 GW of total installed capacity. With PPAs prices ranging from $16 to $35/MWh, the economic competitiveness of solar compared to other generation sources is driving new procurement.
A total of 12.5 GW of utility projects are currently under construction and the development pipeline has reached 51 GW. There have been also announced 64.6 GW (pre-contract).
Wood Mackenzie forecasted a 47% annual growth in 2020, with nearly 20 GW of PV installations expected. Total installed capacity would more than double over the next five years, with annual installations reaching 20.4 GW in 2021. According to “U.S. Solar Market Insight: Q2 2020”, the first quarter of 2020 was largely unaffected by the Coronavirus pandemic, setting a new Q1 record, with 3.6 GW being installed, but impacts are expected to appear in the second quarter and forecasts have changed to a 33% annual growth in 2020, with nearly 18 GW of installations expected, corresponding 14.4 GW to the utility segment.
The U.S. utility PV market was poised to see 83.2 GW installed from 2020 to 2025 pre-covid values Nevertheless, although the sector growth expectations have been lowered, experts believe that the ability of the U.S. to adapt and its constant commitment to innovation will position the U.S. solar market at the forefront of the PV sector internationally. An example of this would be the rapid growth in the United States of bifacial installations, a technology that is expected to lead the solar sector, with estimates of 2 GW of bifacial installations in 2020, and bifacial module capacity exceeding 7 GW by 2024.
Latest stories
Related posts
Market analysis
India's 44.5 GW year: why deployment speed is raising the bar for design discipline
India's 44.5 GW year is reshaping solar project design. Lenders are raising the bar on documentation and traceability. Here's what that means for your project.
Updated 21 JUL, 26


Market analysis
Türkiye's solar boom is outpacing its grid: what that means for project design
Türkiye doubled its solar capacity in 30 months and has 14.6 GW more coming. Here's how to design solar projects that hold up when grid constraints and clipping compound.
Updated 14 JUL, 26

Market analysis
Nordic BESS: from ancillary services to arbitrage
Nordic BESS revenues are compressing as FCR saturates. See how arbitrage and AC/DC coupling design shape the merchant revenue you can actually capture.
Updated 30 JUN, 26