Watch a demo
Harnessing sub-hourly data for your PV project designs
Discover the benefits of sub-hourly meteorological data compared with hourly data.


Pascale Abou Moussa
Product Marketing Manager
Pascale is a marketing expert and Product Marketing Manager at Rated Power. With a background in Neuromarketing, she blends cognitive insights into her strategies. Passionate about understanding the customer needs, Pascale combines her expertise to make impactful contributions to the renewable energy sector.


Content
As a PV power plant designer, you are faced with many important daily decisions on a host of variables. One variable is meteorological activity, which directly affects solar irradiance and, subsequently, the PV power potential of the solar design.
But what data do you have at your disposal to ensure you are making the right design decisions? And how is that data formatted to give you the most accurate view?
When considering meteorological data, you need to decide whether you want it to be broken down sub-hourly, hourly, or, in some cases, monthly. All these options are valid, and your choice will depend on factors like site location, use of batteries, grid regulations, or project stage.
One central component to enabling a successful green transition is ensuring the grid has the capacity to transport and deliver all the new sources of energy being created. To learn more about grid saturation and look at potential solutions, download our eBook: How can we improve grid saturation in the clean energy transition?
This blog will explore sub-hourly calculations based on the results of a test we carried out and then examine how meteorological information can affect solar designs.
Results of our sub-hourly meteorological data analysis

Sub-hourly calculations in RatedPower's software
To identify the differences between hourly and sub-hourly meteorological data, we analyzed energy results from five different countries with different climates (Costa Rica, Chile, Finland, the United States, and Spain).
We simulated various time intervals of meteorological data (hourly, 15-minute, 5-minute, and 1-minute) and different DC/AC ratios (1.2, 1.3, and 1.4). After analyzing the results, we saw consistent outcomes across all the countries.
What we found when the data was closer to 1-min time resolution was:
Higher differences at the irradiance after the transposition to the plane of array (POA) for both beam and diffuse components. The differences in the beam component highlight how simulations with hourly data calculate the sun’s position at an instant of the hour. This may not be representative of the whole hour, masking the actual path of the sun during that hour. The differences in the diffuse component require a deeper evaluation, as sub-hourly simulations could reveal constraints within the diffuse transposition model attributable to its discrete formulation.
Sub-hourly simulations showed higher losses coming from the inverter power limit. These results stem from the fact that the hourly simulations mask irradiance fluctuations that may happen within the hour. So, while these fluctuations average out over the hour, instances of above-average spikes in solar irradiance, generating energy surpassing the inverter limits or storage capacity, are clipped and ultimately lost.
To be clear, sub-hourly meteorological calculations do not optimize your production but highlight where losses might be occurring due to fluctuations in weather conditions throughout the hour. They can, however, help you decide which plant parameters (e.g., DC/AC ratio) are best for your design.
We acknowledge that sub-hourly data can provide greater precision. However, our test did not validate the results against real plant data. Although our analysis confirmed the expected visibility of increased losses, we could not definitively conclude that more precision was achieved because we lacked a reference point for comparison.

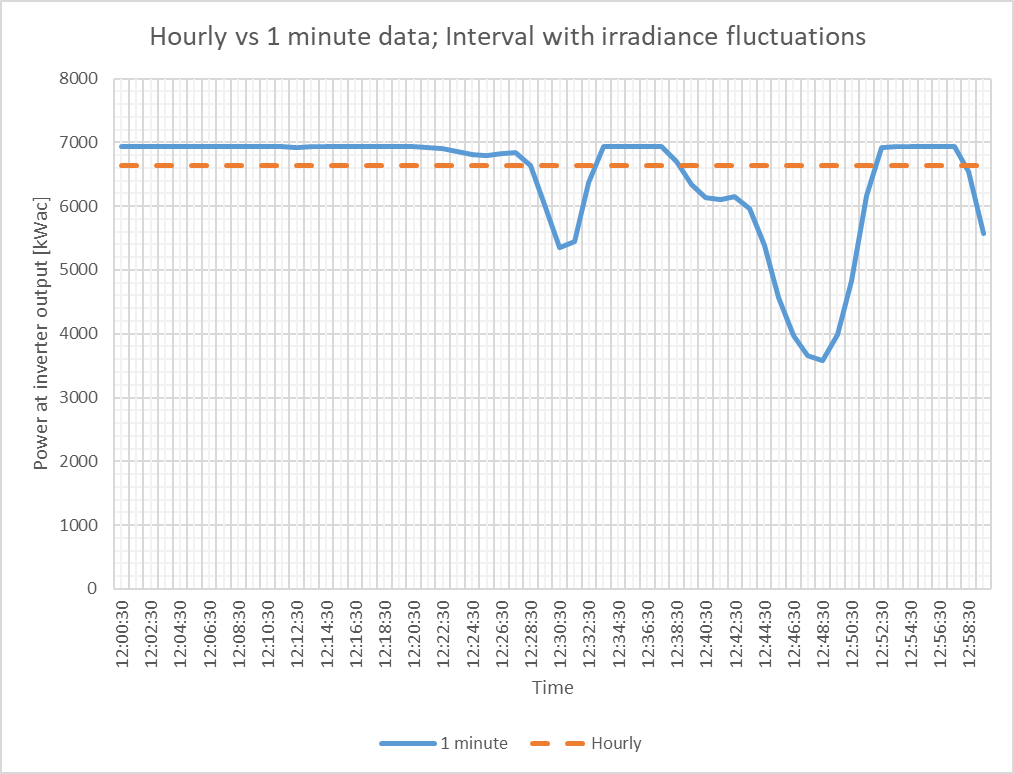
Irradiance fluctuations: Hourly vs. 1 minute data
Leveraging sub-hourly calculations
As mentioned previously, one of the main benefits of sub-hourly calculations is its granularity, which leads to better project estimations. Here is a breakdown of how the data can affect your PV plant design:
Energy production: sub-hourly forecasting of solar irradiance helps make design decisions that can improve the results of energy production.
Grid integration: supports more granular grid management and helps meet grid standards and regulations.
Cloud cover overview helps better understand the effect of clouds on the inverter power limit.
Variability management: manages solar power variability on a sub-hourly basis.
DC/AC ratio: allows the DC/AC ratio to be adjusted to minimize potential financial and power losses resulting from frequent clipping losses.
Design cost: helps adapt designs and reduce costs from the outset.
Storage systems: integrates into storage systems more accurately.
Choosing the meteorological data that suits your project?
Despite the clear benefits of sub-hourly meteorological data, hourly simulations are still highly beneficial in most cases. They provide good information about energy production and require less time to calculate than sub-hourly simulations.
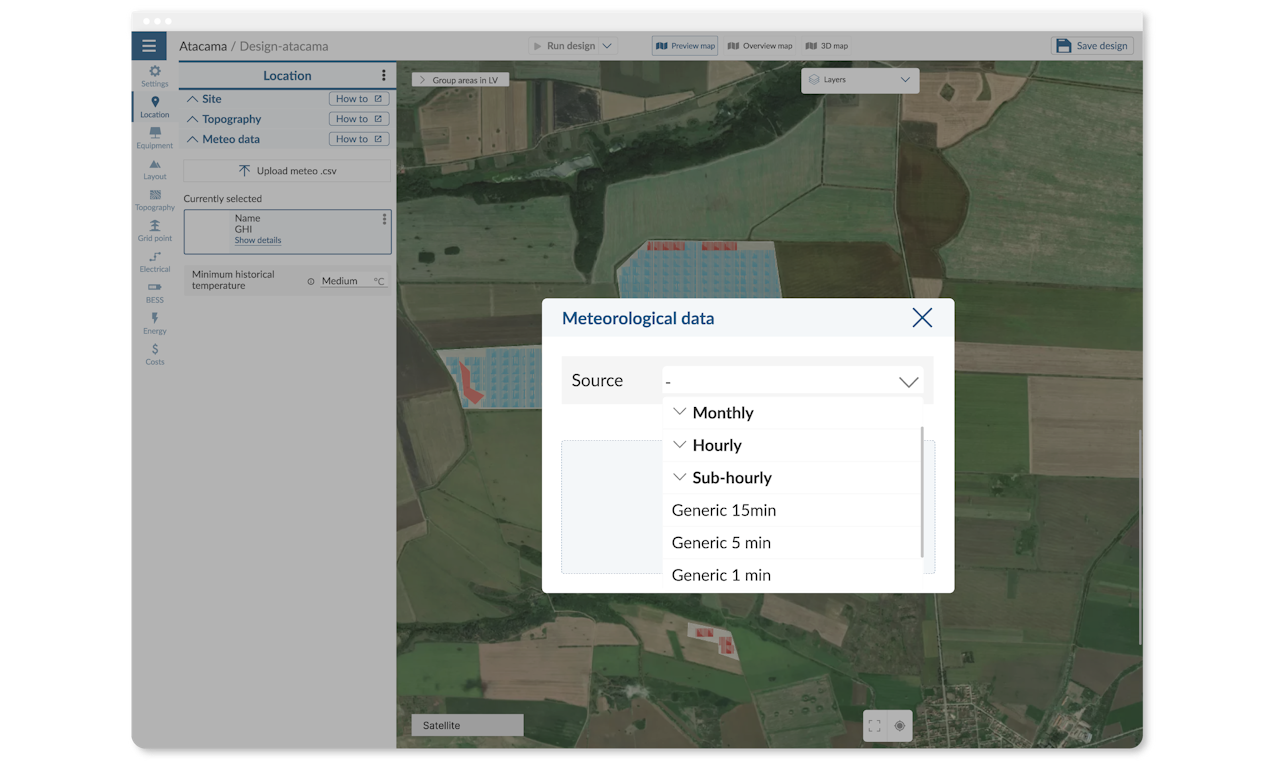
Through RatedPower’s utility-scale solar design software, you have the option to design your solar plant using 1-minute, 5-minute, 15-minute, hourly, or monthly resolutions in the meteorological data.
This gives you the flexibility to choose the solution that better suits your and your stakeholders’ needs. To do so, you’ll need to obtain the typical meteorological year (TMY) file and upload it into the software. The most renowned providers for sub-hourly TMYs are Solargis and Solcast.
You might wonder if you could use a non-TMY file with a sub-hourly resolution. The answer is yes if the format matches our template. However, this approach is not recommended as it does not ensure the best results.
Latest stories
Related posts
Product and corporate updates
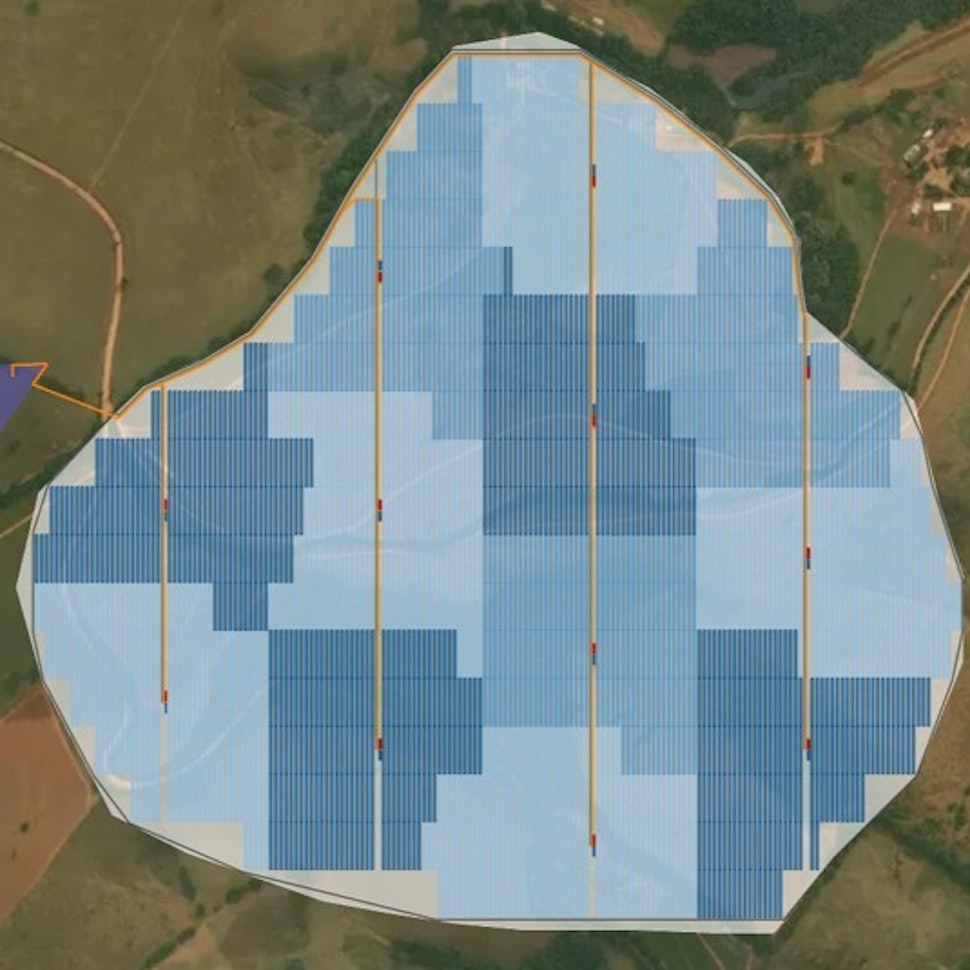
How preliminary grouping decisions shape execution costs
Why do solar layout rework problems keep appearing in detailed engineering? The answer usually comes back to electrical grouping. Here is how to get it right from the start.
Updated 8 JUL, 26


Product and corporate updates
PRISM: Discovering Land for Solar Growth in Australia
Learn about the planning, zoning, and grid access issues slowing clean energy development in Australia, and how federal and state programs are working to help.
Updated 26 MAY, 26


Product and corporate updates
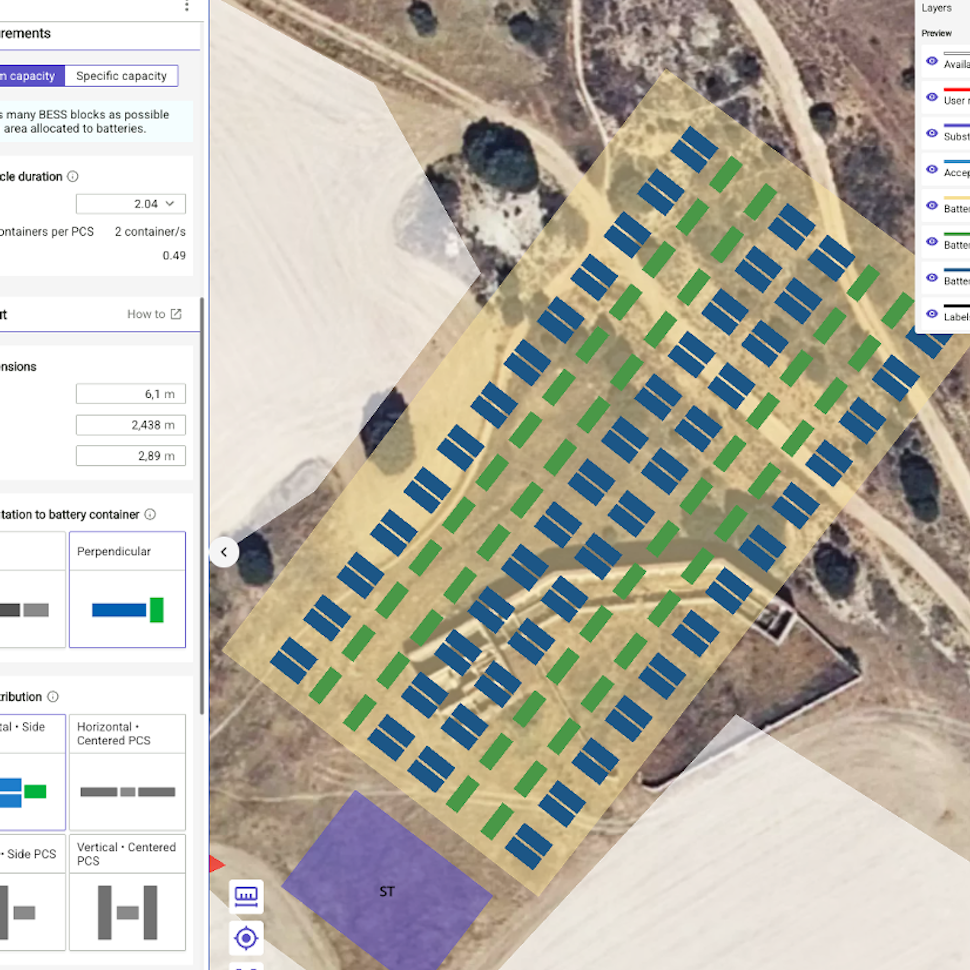
Pre‑defined BESS layouts: Reduce risk before permitting
Compliance-first BESS layouts reduce rework, delays, and risk. Read to discover how compliant spacing and layouts speed permitting and avoid redesign.
Updated 12 MAY, 26