Watch a demo
Utility, commercial and residential solar: Breaking down growth


Laura Rodríguez
Territory Manager Oceania & Nordics
Laura is a renewable and software industry sales professional, currently working at RatedPower as Territory Manager Oceania & Nordics. With a background in International Business and International Trade, Laura previously worked in the business strategy area in various companies as well as as a market analyst for the Government of Spain in Australia.

Content
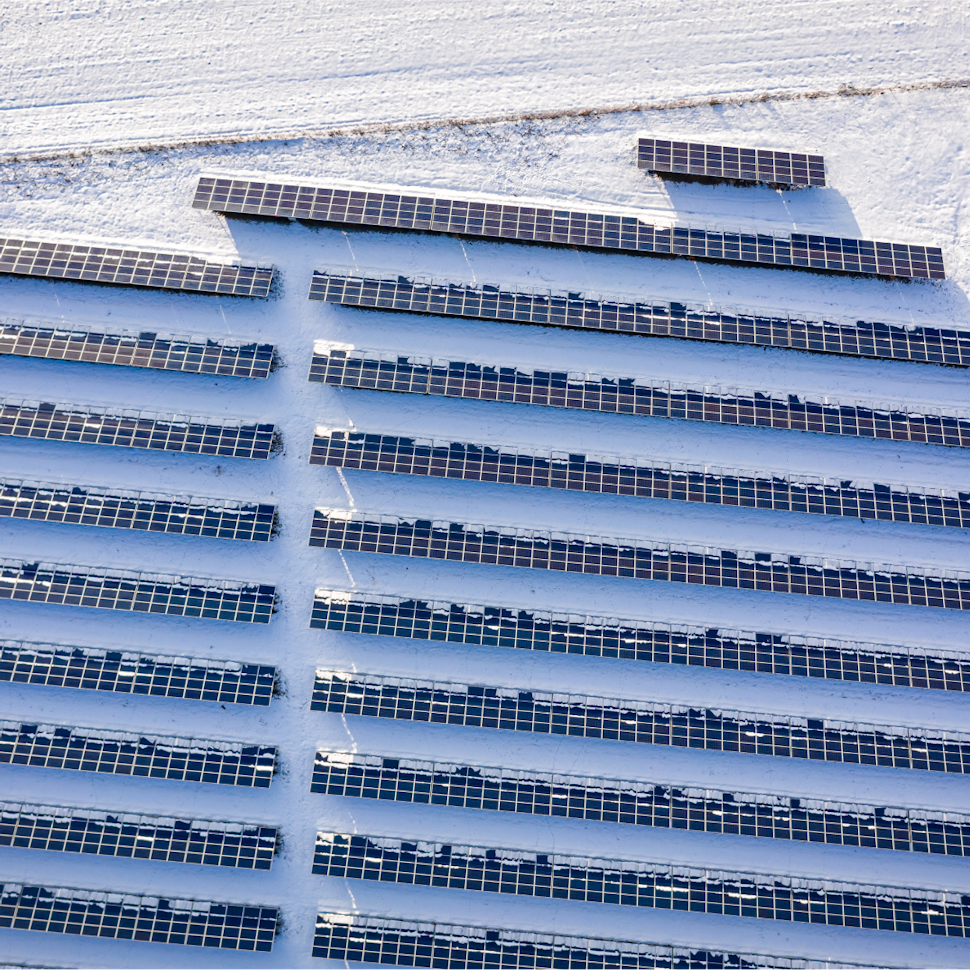
Solar PV has been one of the few industries that has come out stronger after Covid-19. There are different sectors within the industry and we were asking ourselves: Which sector has shown the most positive impact: Utility scale, commercial and industrial or residential solar?
In order to analyse the consequences of Covid-19 on the different solar segments worldwide, we will start by looking at historic solar sector installed capacity and net additions. We will then compare them to other conventional energy and renewable sources. Finally, we have based our investigation in different reports by Solar Power Europe and IEA to compare the sector’s outlook before the pandemic and after it.
Solar energy overview
Solar has kept reaching new records in 2019 and prospects for 2020 are promising too, even with Covid-19.
According to IEA, 627 GW were installed all over the world by the end of 2019. 18 countries installed at least 1GW of PV and 9 countries reached the landmark of more than 10GW cumulative solar capacity by 2019.
In terms of markets, as of 2019, China maintained the leadership being the first world’s PV market. However, if we compare the evolution of annual installed capacity by country and region, as seen in the following graph, we can see that China’s leadership was undermined in 2019. If in 2018, the country added over four times more solar than the second largest market in the world (USA), in 2019 China’s new capacity additions descended to 30,1 GW while those of the USA grew to 13,2 GW. The percentual change therefore has been diminished by half.
Overall, the global new PV installations market surpassed the 100 GW mark for the third year in a row hitting a new record. Despite the slowdown of the Chinese market, the global market increased thanks to the growth of the market outside of China.
Capacity additions increased in the United States, the European Union, Latin America, the Middle East and Africa. In the European Union, solar PV additions increased 98% year-on-year in 2019 led by the faster deployment in Spain, Germany and the Netherlands.
Watch the recorded webinar "A utility-scale solar guide to plant interconnection for maximizing efficiency" for expert insights from industry leaders in renewable energy software solutions.
Capacity: Solar energy vs alternatives
Although solar didn’t grow as strong as years before, in 2018 there was an increase of generating capacity of 4%. Nevertheless, solar still eclipsed any other power generation technology in 2018. In the same year, more solar PV was deployed than all fossil fuels and nuclear together. Solar also added more capacity than all renewables combined and had twice as much installed than wind power.
Moreover, recent data from 2019 shows that solar PV generation increased 22% (+131 TWh) in 2019 and represented the second-largest absolute generation growth of all renewable technologies, slightly behind wind (154 TWh) and ahead of hydropower (36 TWh).
In terms of generating capacity, solar reached 108 GW (growth +11,3%) and wind 60,4 GW (growth + 22,2%) while hydro new capacity added only 12,9 GW which meant a contraction of growth to -44,6%.
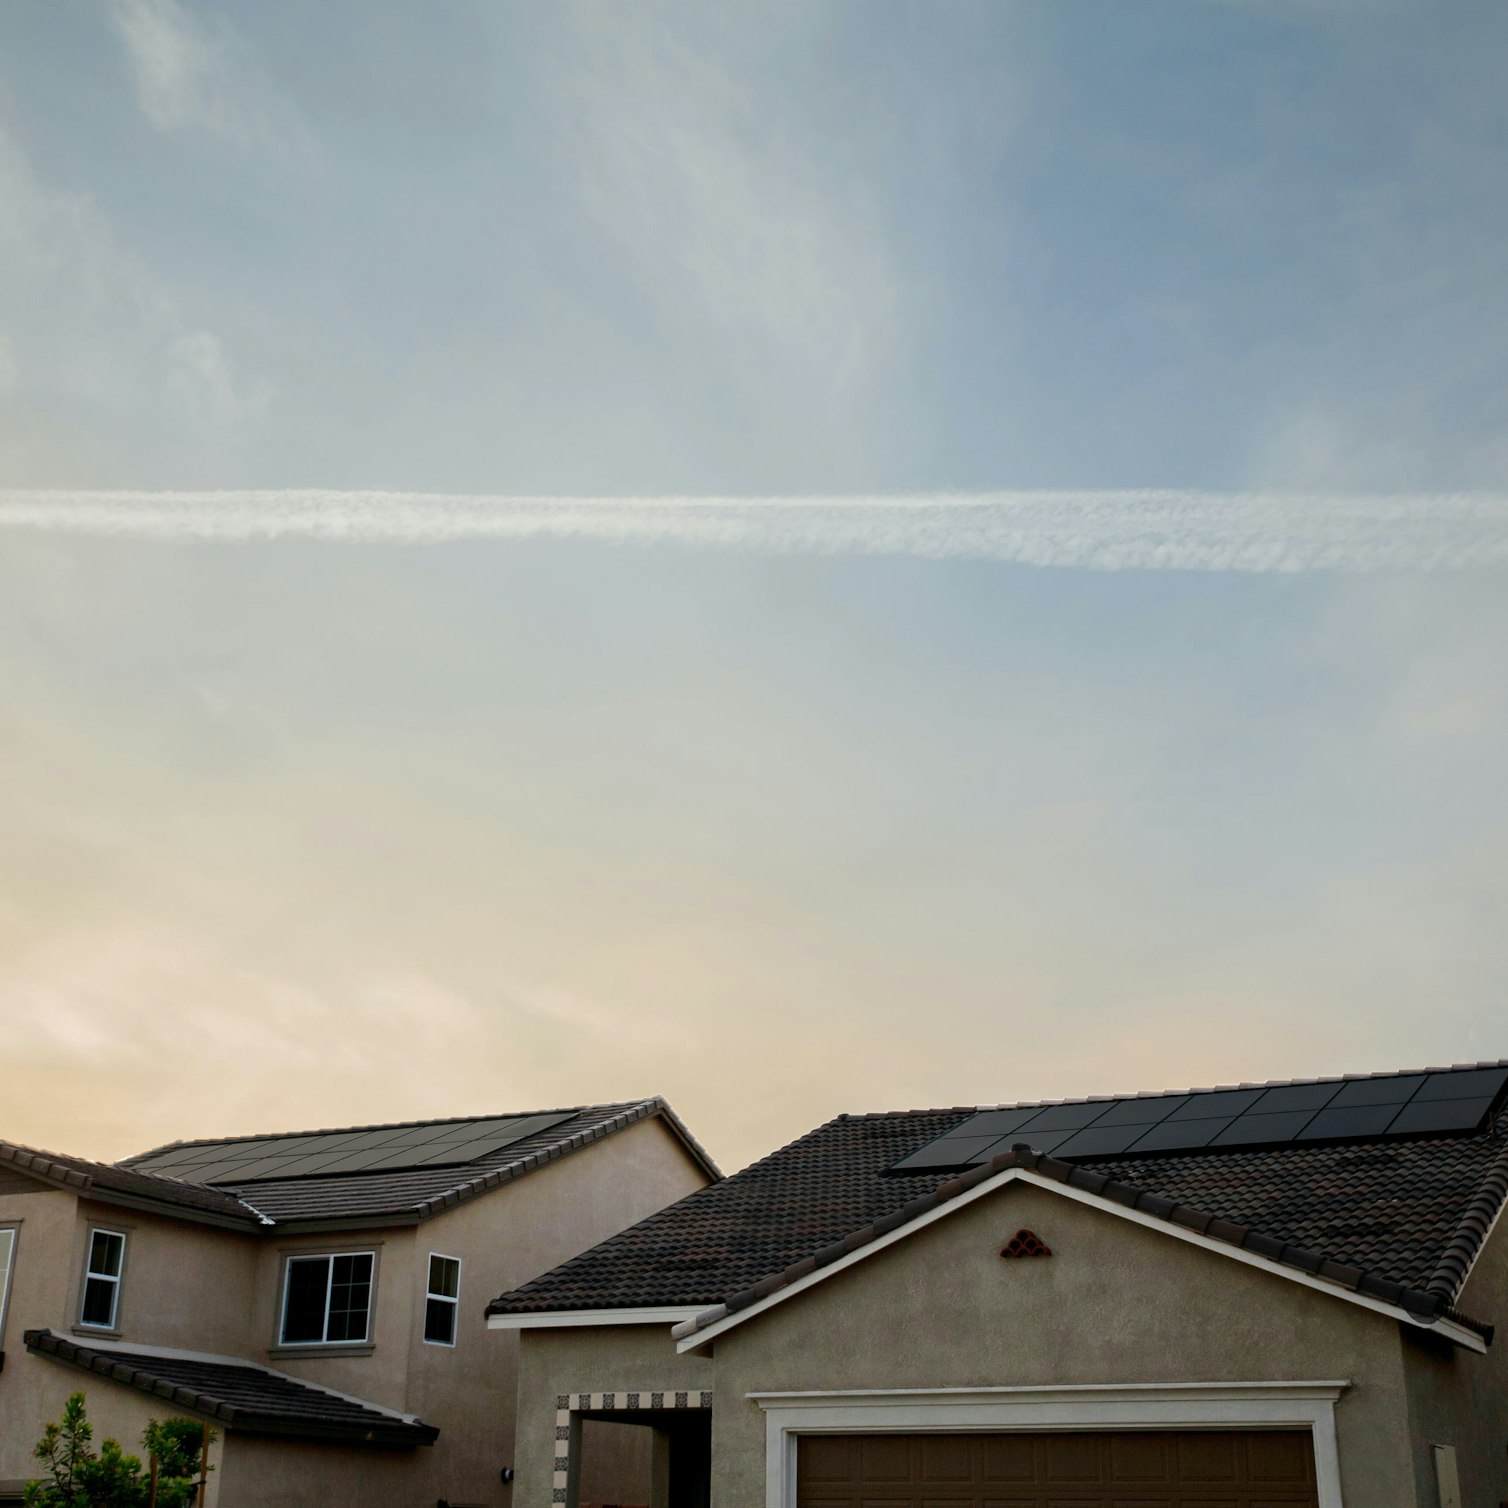
Solar growth: Utility, commercial and residential
According to the IEA, in 2019 58% of PV solar capacity were utility-scale systems (347 GW), 30% were commercial systems (176 GW), and only 12% corresponded to residential systems (74 GW).
Nevertheless, this scenario might be soon starting to change.
If utility-scale solar systems today represent 58% of total worldwide capacity, in 2016 it represented 75.5%. In the last 4 years, PV commercial and residential systems have grown 104% and 181% respectively while utility scale systems only grew by 16.1%.
Only in 2019, residential solar experienced an outstanding growth doubling its installed capacity from 8.1 GW to 16.3 GW and prospects could have been even more positive if it wasn’t to Covid-19.
Solar energy drivers
In two words—falling prices.
The global benefits of renewable energies have been known for many years now, however, it wasn’t until this last decade that wind, and especially solar, was mass deployed with an installed capacity from 40 GW in 2010 to more than 670 GW in 2019 (x16).
The cost of new solar PV and onshore wind energy installations has fallen by 3-10% annually since 2010 to reach parity with fossil fuel facilities. Costs for electricity generated from new solar PV plants were 83% lower in the second half of 2019 than a decade earlier, according to the FS-UNEP Report.
According to the global review by Lazard Capital, solar’s power generation cost (LCOE) decreased by around 14% year-on-year in 2018 enabling power prices in the 2 US cents per kWh range in hot climate places around the world. In comparison with conventional energy sources, utility-scale PV and wind offer nowadays a more competitive investment perspective.

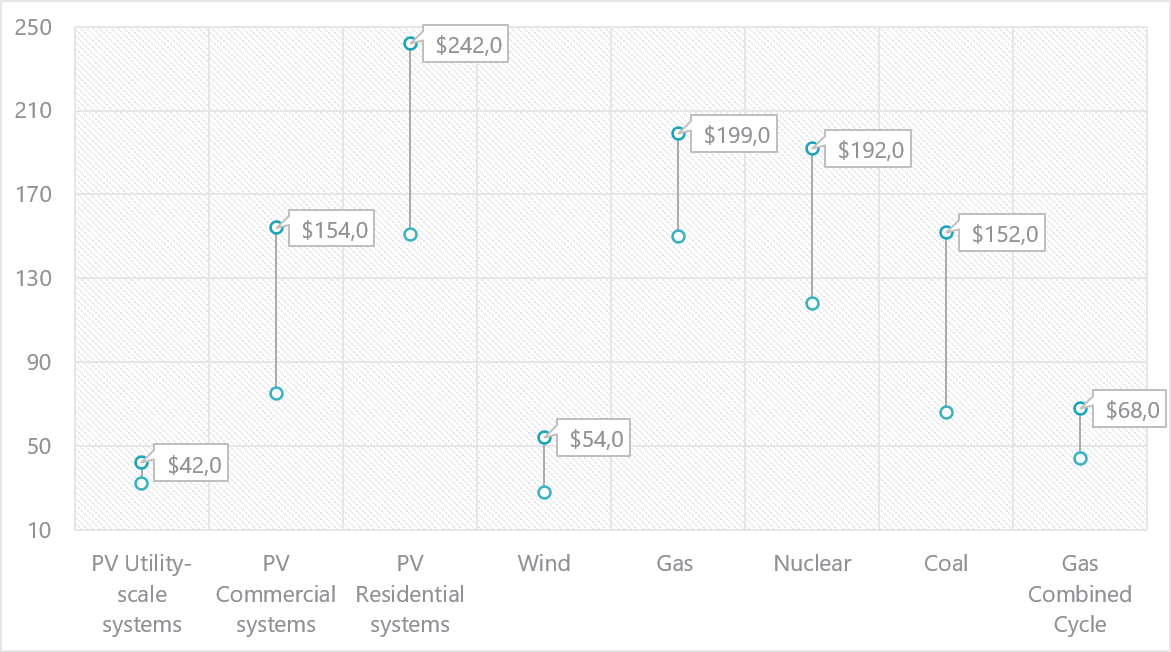
Solar power generation cost (LCOE, 2018) (Source: IAE)
Estimating the unexpected
According to a global review by Solar Power Europe, before the covid outbreak, utility scale solar capacity was expected to grow on a conservative scenario to 134.5 GW by 2023. On the other hand, rooftop solar was estimated to reach the 60 GW installed capacity by 2023 and double the figures of 2018.


More recent data from IEA see stable growth in 2020 despite the Covid-19 pandemic. By segment, while utility-scale solar is estimated to hold stable with an installed added capacity of 67.6 GW (versus 65.6 GW in 2019), residential installations could reach a record of 19 GW of added capacity (versus 16.3 GW).
As a longer outlook of the sector after Covid-19, the IEA estimated solar capacity additions to reach 144.5 GW (both rooftop and utility) by 2023 with a growing importance of both residential and commercial deployment.

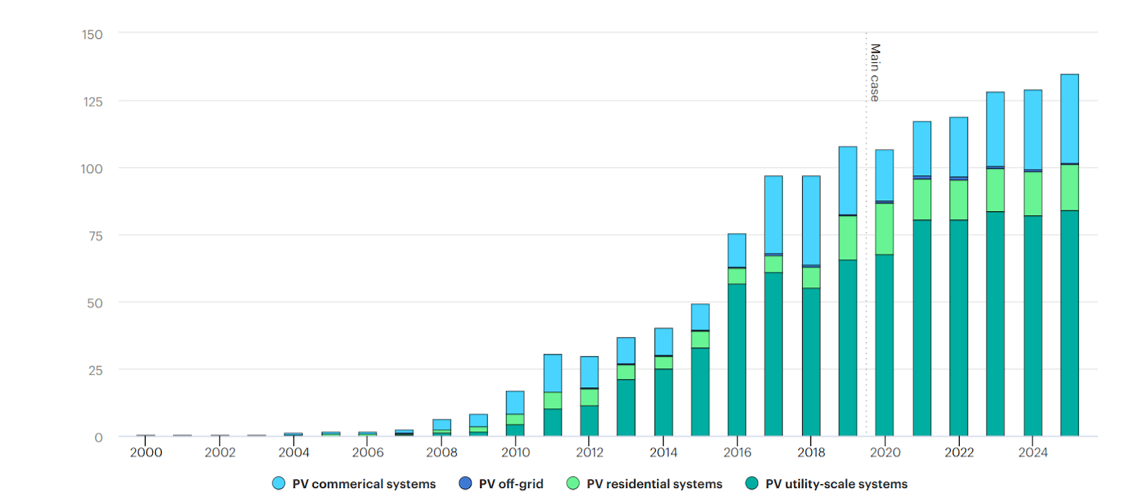
PV by segment capacity net additions (1990-2025) (Source: IEA)
Overall, as we have discussed in previous blog posts, as any other industry on Earth, Covid-19 has affected solar future perspectives, especially in the short-run. Nevertheless, some segments such as residential solar and utility scale might still observe a record growth.
In the medium/long run, growth could be larger than what was estimated before the global pandemic due to several factors.
On the one hand, we have been seeing an important focus worldwide by governments on leveraging photovoltaics as an economic recovery source after the pandemic. On the other hand, people have realised even more of the importance of sustainability and self-sufficiency.
These two drivers could define the industry outlook enormously and we can’t wait to see how the market evolutions.
Keep posted for our next Ebook regarding Stepping into a Post-COVID Economy: How Renewable Energy and Photovoltaics Will Play an Essential Role in its Recovery. Get a free copy.
If you would like to know how, with RatedPower, we help professionals develop utility scale solar at a faster and more efficient way, we encourage you to deep dive in our website and take a free product tour.
Latest stories
Related posts
Market analysis
India's 44.5 GW year: why deployment speed is raising the bar for design discipline
India's 44.5 GW year is reshaping solar project design. Lenders are raising the bar on documentation and traceability. Here's what that means for your project.
Updated 21 JUL, 26


Market analysis
Türkiye's solar boom is outpacing its grid: what that means for project design
Türkiye doubled its solar capacity in 30 months and has 14.6 GW more coming. Here's how to design solar projects that hold up when grid constraints and clipping compound.
Updated 14 JUL, 26

Market analysis
Nordic BESS: from ancillary services to arbitrage
Nordic BESS revenues are compressing as FCR saturates. See how arbitrage and AC/DC coupling design shape the merchant revenue you can actually capture.
Updated 30 JUN, 26