The importance of internal rate of return (IRR) in solar plant design


Jeremy Vickerman
Senior Content Manager
Senior Content Marketing Manager at RatedPower with extensive experience in content strategy, production, and communications. Over a decade of expertise spanning marketing, recruitment consulting, and public relations across the UK and Spain, with a strong track record in driving brand visibility and audience engagement.


Hassan Farhat
Lead Technical Advisor
Hassan Farhat has a background in Energy Engineering and excelled in his Master of Science in Renewable Energy in Electrical Systems. More than three years ago, he joined the RatedPower technical team, where he works as a Solar Photovoltaic Engineer and Customer Success Manager at RatedPower.
Hassan has a thorough understanding of the industry and of RatedPower’s pvDesign, the digital solution to reduce LCOE and maximize productivity of utility-scale PV plants. He's passionate for renewable energies and their role within the global environmental transition.
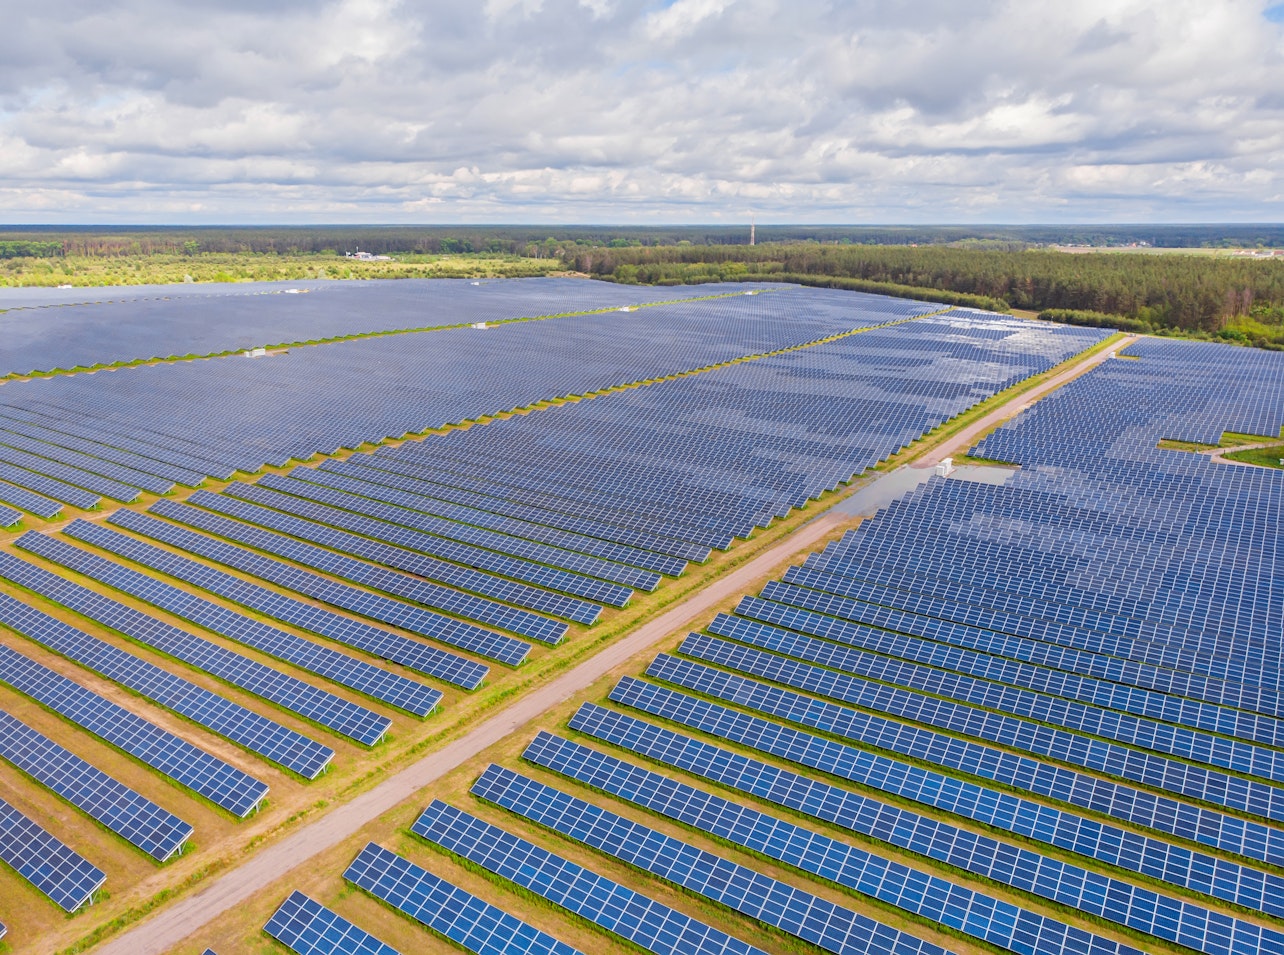
What is internal rate of return (IRR) and how does it affect design and investment decisions for solar projects? Read on to find out.
Content
What is IRR?
The internal rate of return (IRR) is a percentage estimate used to evaluate investments. In business, particularly the solar industry, it helps determine if a project or investment is profitable.
IRR is calculated similarly to another financial metric called net present value (NPV). But instead of showing the total expected profit in dollar amounts, IRR shows the estimated annual rate of return as a percentage.
For example, an IRR of 20% means the investment should generate a 20% rate of return each year. As a rule, higher IRR percentages are generally better when comparing potential investments.
IRR helps companies rank and select capital projects to pursue based on profitability. Investors also use IRR to evaluate returns on different assets when building their portfolios.
Solar project investors use this financial concept to determine if a renewable energy project has profit potential.
What are the basic components of IRR?
IRR relies on a financial formula to perform the rate of return calculation. Some components of the IRR formula include:
PV system cost (PVsys) — The upfront installed cost of a photovoltaic system
First cost subsidies (PVfcs) — Financial incentives like rebates that reduce initial PV system costs
PV energy cost (EPVc) — Total lifetime cost of energy from the PV system, including maintenance
Secondary market characteristics (SMC) — Additional solar incentives like carbon credits
PV energy price (EPVp) — Lifetime value of energy produced by the PV system
Cash inflows — The expected future cash profits from the investment over time
Discount rate — This adjusts the value of future cash flows to current dollar terms

Internal Return Rate Calculator for PV plants
By inputting costs, incentives, and projected energy value, the IRR formula calculates the breakeven internal rate of return percentage. Using this info, an internal return rate calculator figures out the breakeven discount rate that makes the investment's net present value equal to zero. The resulting figure becomes the projected internal rate of return.
Many experts use IRR as a comparison tool. For example, if a PV plant owner wants to install a new brand of panels, they can calculate the predicted return of all their options and make an educated guess as to which will turn the most profit.
NPV estimates the current value of future cash flows from a solar plant by factoring in inflation, risk, and the time value of money. A higher NPV signals a more profitable PV project. NPV uses a formula summing the present value of each year's expected cash flow over the project lifespan.
By inputting all projected costs and electricity sale revenues into the IRR calculation, solar developers can rank competing PV projects by profitability to select the best investments. Tracking actual IRR over time verifies that positive returns meet targets.
Can IRR be negative?
Yes, the internal rate of return metric can sometimes be a negative value for an investment. An investment should lose money if the only possible IRR rate making NPV zero is a negative figure.
For example, an IRR of -5% would signify anticipated annual losses of 5%. This effect could happen if upfront costs are high and future predicted revenues remain low, causing net losses.
In some cases, no positive IRR rate satisfies the NPV equation. Other times, multiple IRR rates, both positive and negative, are possible. Approximation formulas help estimate IRR in complex situations.
But the short answer remains yes, IRR can reach negative territory if projections show an investment losing money over time rather than earning annual returns. Evaluating negative IRR percentage rates informs companies that certain projects or assets may not be profitable.
List of assumed elements to include in an internal return rate calculator
Remember, many things can go into calculating IRR for a solar project. Below are some additional elements that could factor into calculating IRR for solar projects:
- Cost of the installed solar system
- Solar module wattage and efficiency
- Expected solar energy production per year
- Original and replacement inverter costs
- Applicable incentives like rebates and tax credits
- Current average electric usage and utility costs
- Annual solar panel degradation percentage
- Projected utility inflation rate
- Taxes and income tax rate
- Expected system lifetime
Example IRR Calculation
If you want to calculate IRR for a solar energy plant, assemble all the assumptions and variables that impact your project. Note that a major input is the price per kilowatt-hour charged by the local utility company.
Let’s try a simple example.
Assume two companies — Company X and Company Y — find a PV solution that reduces their electricity usage by 50%. They invest $2,000 in this new system.
If Company X and Company Y use 20,000 kWh of electricity monthly, but Company X pays 5 cents per kWh and Company Y pays 8 cents per kWh, Company Y made the better investment.
Here’s why:
The usage of electricity for both will be cut in half with the new system (20,000 to 10,000 kWh). So — for Company X — we can multiply .05 by 10,000 for potential savings of $500. For Company Y, we multiply .08 by 10,000 to get savings of $800.
Both companies now save 50% on electricity annually. Company X went from paying $1,000 to $500, and Company Y went from paying $1,600 to $800.
We consider these figures as positive cash flows. So, Company X would have a positive cash flow of $500/year, while Company Y would save more ($800/year). While they save the same percent, Company Y wins in the long-run.
Accounting for their initial investment of $2,000, and assuming they save $800 for the next five years, Company Y would achieve an IRR of 28.649%. While Company X would have an IRR of 7.931%, ensuring Company Y made the smarter investment.
Again, this formula can get very complicated with more variables in play. However, this example shows how IRR can affect companies’ bottom lines.

Design utility-scale solar at lightning speed
Benefits of including financial analysis in your PV system designs
Join our PV expert, Bernardino Martín as he discusses how incorporating accurate financial estimates in your PV projects designs from the early stages can help you mitigate risks down the funnel.

Latest stories
Related glossary posts
Market analysis
What is polysilicon and how is it made?
Updated 14 MAR, 24
Market analysis
Understanding CAPEX and why it’s important for solar PV projects
Updated 13 MAR, 24

Related posts
Market analysis
Battery Storage in Africa: From Backup to Backbone
See why Africa is prioritizing off-grid battery storage that operates independently, as 50% of its population doesn’t have access to a stable power supply.
Updated 19 FEB, 26
Market analysis
How Italy is repowering aging solar into assets
Discover more about how Italy is breathing new life into its aging solar plants, boosting output, and driving toward the country’s 2030 climate goals
Updated 27 JAN, 26

Market analysis
23 renewable energy events to look out for in 2026
Discover the top renewable energy events in 2026, dates, details, and insights for solar, storage, hydrogen, and clean energy professionals worldwide.
Updated 13 JAN, 26

- RatedPower
- Glossary
- I
- Internal rate of return (IRR)
 Watch a demo


