Watch a demo
Utility-scale solar financial analysis: Is there life after LCOE?


Laura Rodríguez
Territory Manager Oceania & Nordics
Laura is a renewable and software industry sales professional, currently working at RatedPower as Territory Manager Oceania & Nordics. With a background in International Business and International Trade, Laura previously worked in the business strategy area in various companies as well as as a market analyst for the Government of Spain in Australia.

Content
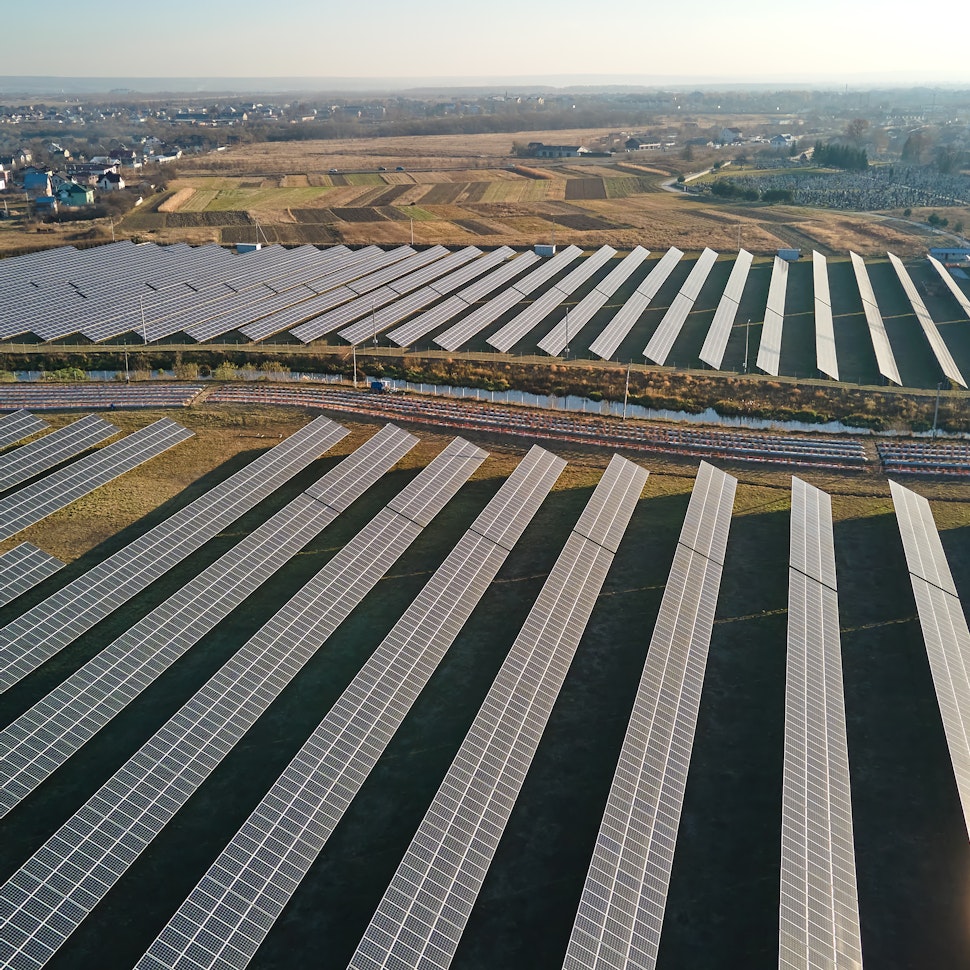
Energy markets are becoming increasingly volatile. And with the focus shifting to low-carbon generation, it’s key that solar photovoltaic (PV) projects are evaluated using holistic financial analysis with robust and effective metrics.
By analyzing financial key performance indicators (KPIs), project developers and asset owners can identify the best investment opportunities and avoid potential losses. This data can also help them to optimize projects with a view to maximizing returns.
Financial KPIs that matter for solar plant design
Let’s look at some of the financial metrics that developers and investors can analyze and track to compare projects and achieve the highest returns.
Levelized cost of electricity (LCOE)
The levelized cost of electricity (LCOE) is a good place to start. LCOE calculates the cost of building, operating, and maintaining a project over its full lifespan. It takes into account the lifetime cost of a plant and the amount of electricity it is expected to generate over its lifespan to measure the average cost per unit generated.
Rated Power offers an easy LCOE calculation tool tailored for ground-mounted solar PV that generates a comprehensive report with just a few inputs.

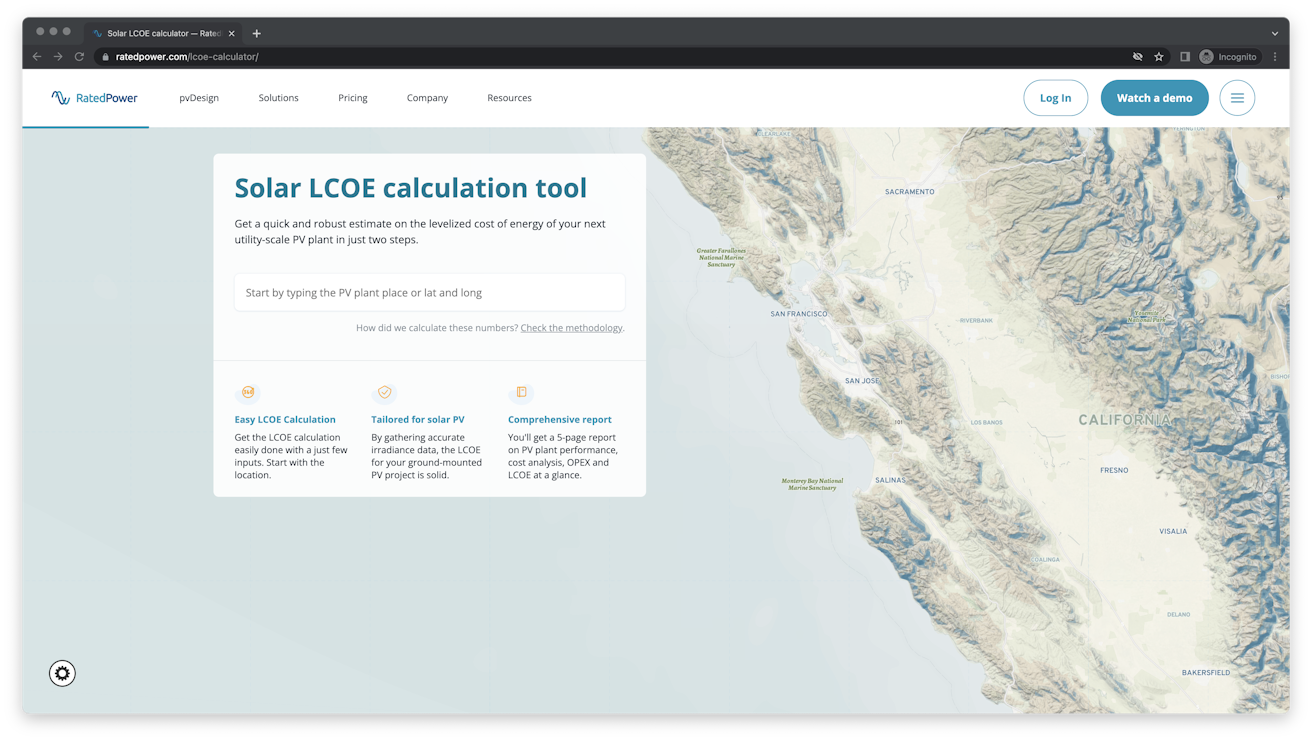
Get a quick and robust estimate on the LCOE of your next utility-scale PV plant in just two steps with our LCOE Calculator Tool!
But in 2022, project analysis also needs to take into account other factors.
Net present value (NPV)
Sometimes referred to as the time value of money, the net present value (NPV) analyzes a project’s profitability by looking at the value over time in present-day terms. It takes into account inflation, risk, and the opportunity cost of investing in a particular project rather than an alternative asset.
NPV is calculated as the sum of discounted cash flows over the lifespan of a project. The formula is:
PV= FV/(1+i)^n
Where PV is present value, FV is future value, i refers to the discount rate and n equals the number of time periods (years).
Internal rate of return (IRR)
The IRR is a form of return on investment (ROI). This metric calculates the annual earnings on an investment in a discounted cash flow analysis, so it can be compared easily with another investment opportunity. Developers can use IRR to compare the viability of multiple solar projects and choose the most profitable.
IRR is a discount rate that uses the same formula as NPV to find the annual return that makes the NPV equal to zero. At zero the present value of future cash flows is equal to the value of the investment, so the higher the IRR, the higher the potential return from the project. Tracking the IRR throughout a project can help ensure that it achieves positive returns.
Benefit-cost ratio (BCR)
The benefit-cost ratio is used to determine whether a project offers value for money in present-day terms. The benefits and costs of a project are handled as monetary cash flows or equivalents, to incorporate non-monetary benefits or internal company costs. This makes it easier to compare different solar projects and compare solar projects to other types of electricity generation.
The BCR is calculated by dividing the PV of the cost benefit expected from a project by the PV of the total cash cost.
If a project’s NPV is positive and the BCR is higher than 1, it is likely to be profitable. If the NPV is zero and the BCR is equal to 1 the project breaks even in present-day monetary terms. But if the NPV is negative and the BCR is lower than 1, the project is likely to lose money.
Payback period
The payback period refers to the length of time it will take for a project to recover the initial cash investment.
For a solar project, the payback period is calculated by dividing the net cost after any subsidies or other incentives have been applied by the annual revenue or cost savings. For example, if an installation costs $100,000 and brought in $20,000 per year in revenue from electricity sales, the payback period would be five years.
However, a simple payback calculation does not take into account inflation, depreciation, land leasing, maintenance costs, and other factors such as the lifespan of the project. The payback period alone does not give any indication of the return on investment, so it is best used in combination with the IRR and/or NPV.
Plant availability (PA)
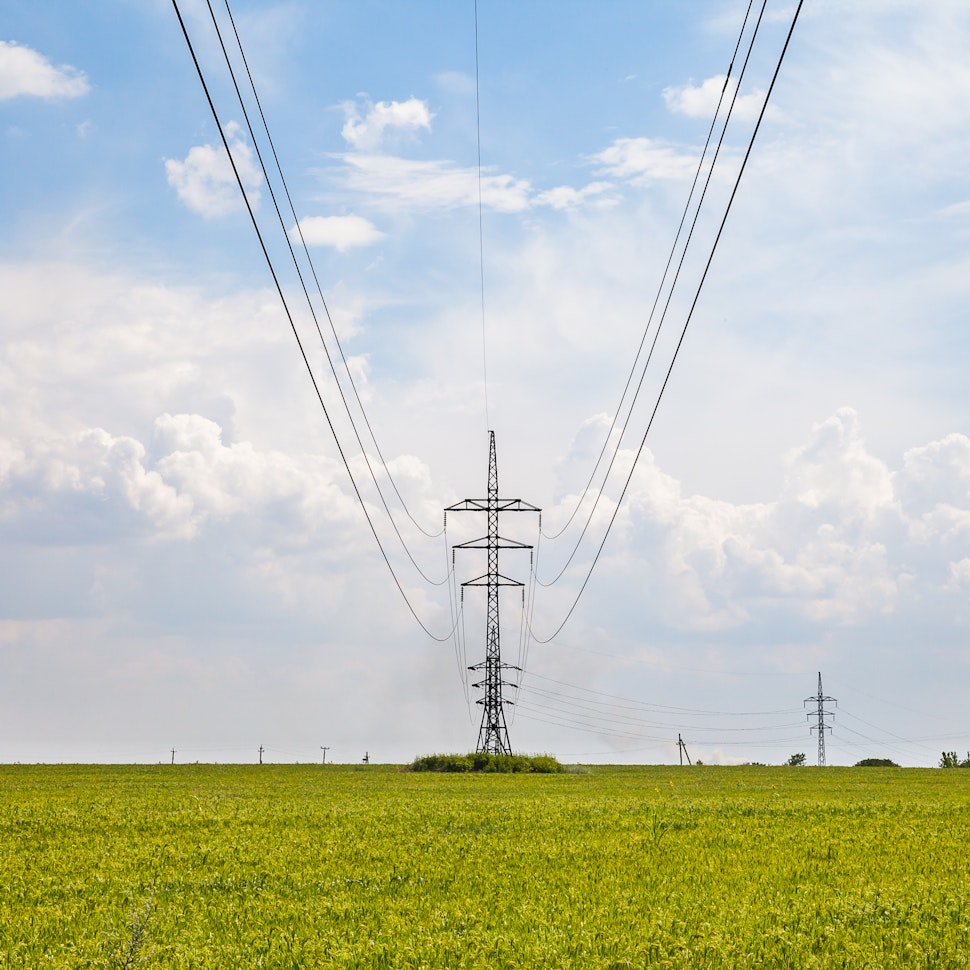
Plant availability (PA) refers to the operational uptime of a generation source. If a plant is taken offline for planned maintenance, an unplanned outage, or other disruption — such as a grid switching off renewable generation for balancing — then availability declines and revenue decreases.
The PA is expressed as the percentage of the time that a plant is available to supply electricity. The higher the PA, the higher the return it can generate.
Solar PV plants can reach a PA above 98%, compared with wind farms at 95+% and 80+% for gas, nuclear, and coal-fired power plants.
Performance ratio (PR)
The performance ratio (PR) is calculated as a percentage, comparing the actual electricity output with its theoretical output over a year. PR can be measured in RatedPower and the formula is as follows:
kWh/(Irradiance(kWh/m2) on PV panel x active area of PV module(m2) x PV module efficiency.
The PR takes into account grid availability, the minimum level of irradiation required to generate power, and irradiation levels in a given period. A low PR indicates that a plant is not performing at optimal levels for technical reasons.
It’s worth noting though that solar project output can be lower than its theoretical maximum because of weather, efficiency losses, and site design.
Optimize your solar investment in RatedPower
In this guide, we have looked at some of the many KPIs that can help project and optimize returns for utility-scale solar project investment. Other metrics include carbon emissions saved, profitability index, and cost per watt.
You can manually track KPIs in a spreadsheet, or alternatively, you can automate the calculations by using software tools like Rated Power to update and monitor the values.
Latest stories
Related posts
Market analysis
Solar PV & the german grid: a pre-validation guide
Improve solar interconnection approval odds in Germany. PRISM screens grid capacity; RatedPower produces the permit-ready documentation operators expect.
Updated 28 JUL, 26


Market analysis
India's 44.5 GW year: why deployment speed is raising the bar for design discipline
India's 44.5 GW year is reshaping solar project design. Lenders are raising the bar on documentation and traceability. Here's what that means for your project.
Updated 21 JUL, 26


Market analysis
Türkiye's solar boom is outpacing its grid: what that means for project design
Türkiye doubled its solar capacity in 30 months and has 14.6 GW more coming. Here's how to design solar projects that hold up when grid constraints and clipping compound.
Updated 14 JUL, 26