Boosting PV project profitability with advanced financial KPIs
Find out how RatedPower’s tools help developers analyze and optimize key financial metrics, including net present value, levelized cost of energy, and ROI.


Pascale Abou Moussa
Product Marketing Manager
Pascale is a marketing expert and Product Marketing Manager at Rated Power. With a background in Neuromarketing, she blends cognitive insights into her strategies. Passionate about understanding the customer needs, Pascale combines her expertise to make impactful contributions to the renewable energy sector.

Content
In October 2024, RatedPower hosted Boosting PV Project Profitability with Advanced Financial KPIs, a live webinar for solar plant developers and financial analysts seeking practical ways to increase revenue from PV projects.
RatedPower territory manager Ghada Alafranji (who oversees our Middle East, Nordics, Africa, and India markets) and product owner Bernardino Martín Apolinario (a PV generation solutions expert) led the session.
The speakers demonstrated how RatedPower’s tools help developers analyze and optimize key financial metrics, including net present value (NPV), levelized cost of energy (LCOE), and return on investment (ROI). They also explained how the RatedPower platform could be used to define operational expenses (OpEx), upload revenue profiles, and simulate multiple scenarios to tackle challenges like profitability forecasting and cost management in solar plant development.
We have concluded the blog with several questions from the live Q&A and other common customer queries.
Missed the live webinar? You can still watch the recording. We’ve also summarized some of the main points in this blog.


Challenges and importance of early financial KPI analysis
It is vital for utility-scale solar projects to tackle financial implications right from the start. Projects with high upfront costs and uncertain energy yields often have limited access to financing, stalling progress or even jeopardizing the project’s viability.
On top of this, developers also grapple with unpredictable operation and maintenance costs against the backdrop of ever-shifting regulations and market conditions.These hurdles make it critical to establish a clear financial strategy early in the project’s lifecycle.
Metrics like NPV and IRR build visibility to give investors confidence in a project’s bankability, which can attract funding and drive critical buy-in.
Early financial analysis also supports design optimization. Running KPIs during initial planning lets developers adjust layouts and components to maximize returns before committing significant resources. This proactive approach helps mitigate risks; it reveals potential cost overruns or regulatory hurdles to reduce surprises that could derail progress.
Lastly, predevelopment financial modeling keeps projects efficient by channeling resources into the most profitable opportunities. With accurate forecasting, developers can save both time and money.
RatedPower simplifies early-stage financial analysis with powerful tools designed to give you a complete picture of your PV and BESS plants’ feasibility. Using the platform’s CapEx model, you can calculate the total project cost, specific cost, and LCOE to understand your financials right from the conceptual design phase, when it’s still easy to adjust layouts and refine technical specifications.
With its latest updates, RatedPower now includes powerful new financial KPIs: NPV, IRR, ROI, payback period, and discounted payback. These metrics help you measure a project’s feasibility and account for operating costs to control risks and prioritize the most profitable scenarios.
How to check your financial KPIs with RatedPower
RatedPower makes it easy to integrate financial analysis into every stage of project planning:
Set up your project. Design your solar project by specifying details like size, technology, and location.
Input financial parameters. Enter critical financial inputs such as PPA price, OpEx, and financing costs. Use RatedPower’s templates for detailed revenue profiles or upload customized pricing data.
Run simulations to generate detailed financial outputs. Analyze metrics such as net NPV, IRR, ROI, payback period, and LCOE.
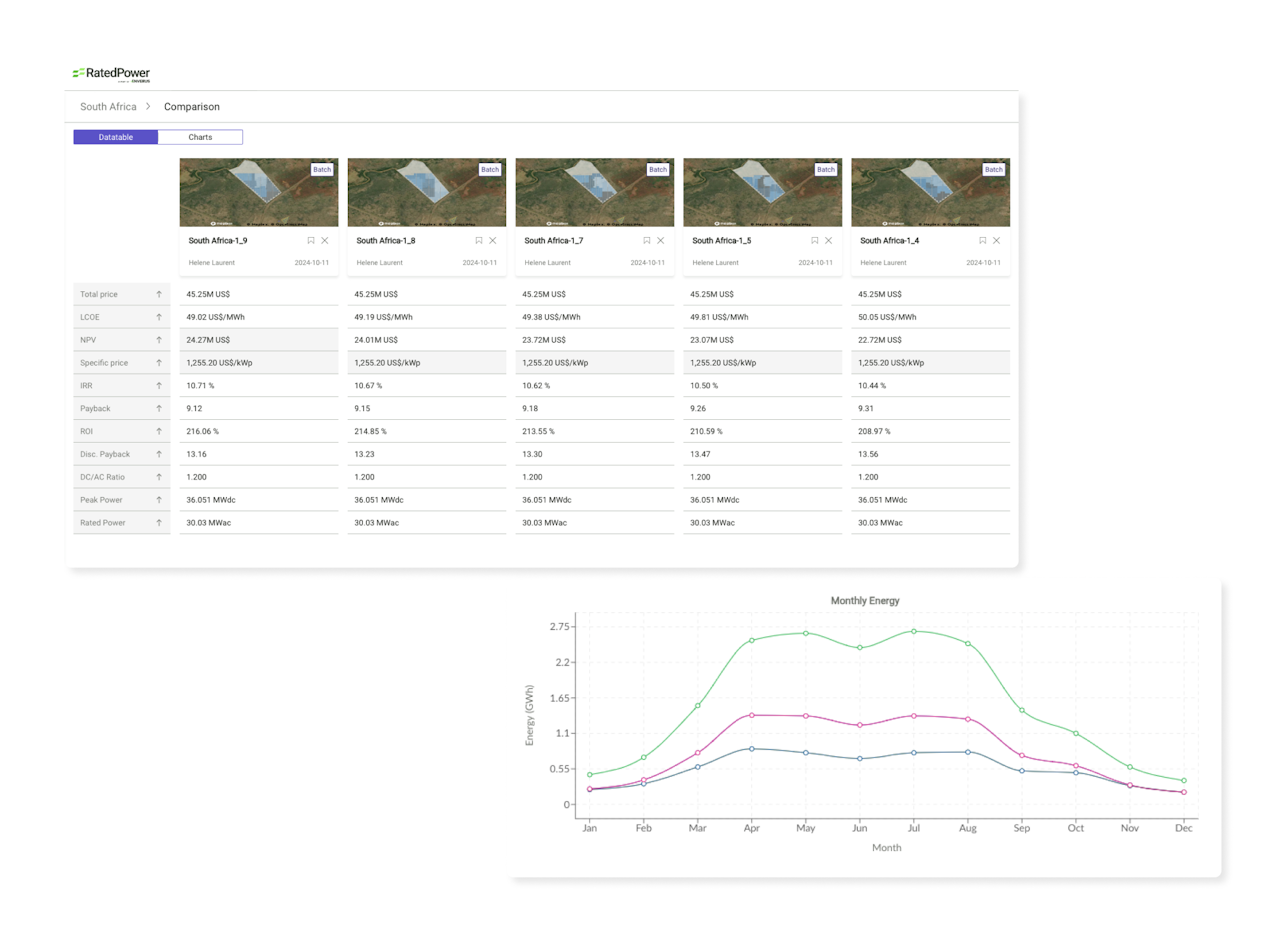
Perform sensitivity analysis. Adjust variables such as PPA price, land costs, revenue escalation, or module degradation rates to evaluate how changes might impact your solar plant’s financial performance over time. You can also simulate multiple scenarios to identify optimal conditions and minimize risks.
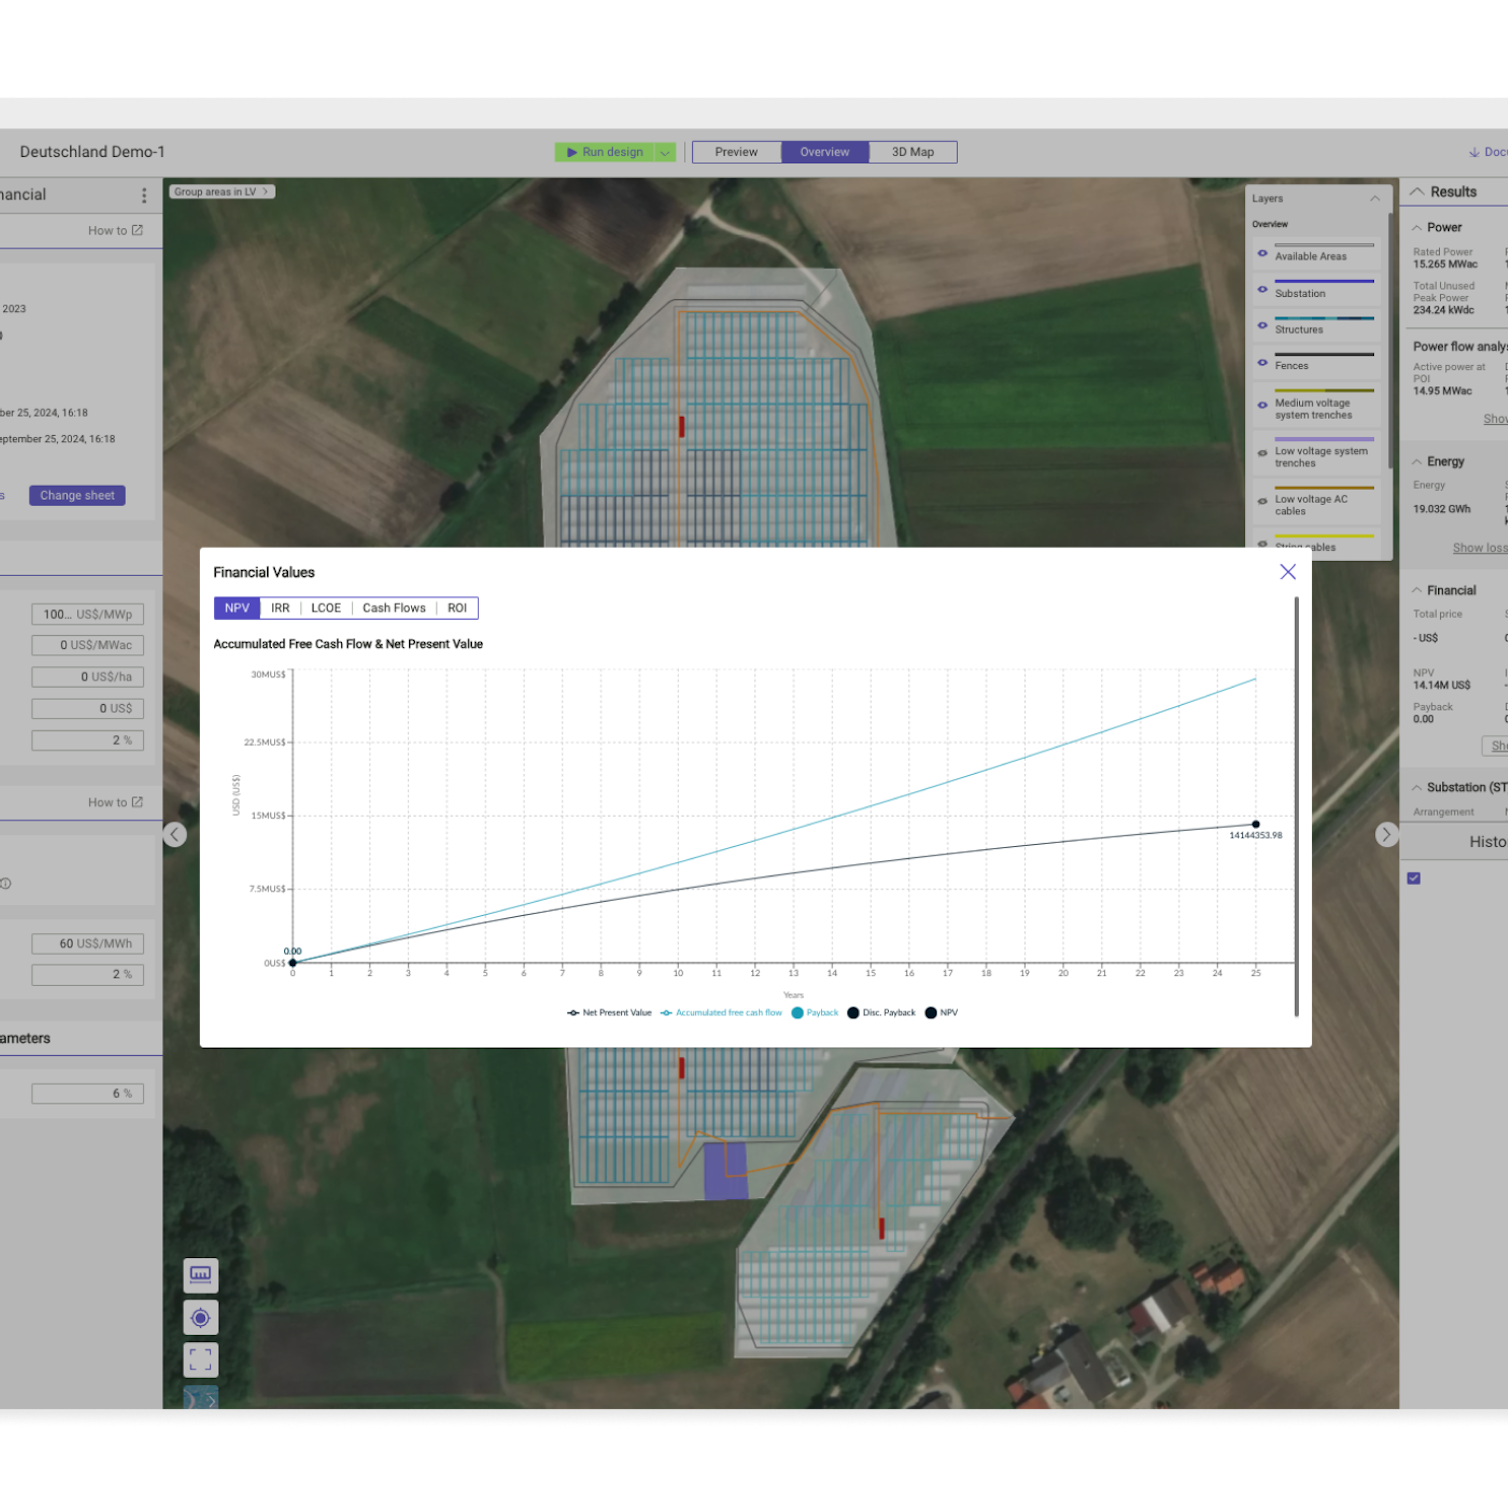
Optimize and visualize results. Use RatedPower’s visualization tools to review charts and graphs that track metrics like NPV and cash flow over time. This allows you to identify trends and refine your design or financial strategy to maximize profitability.

Case study 1: Spain
This case study shows how to use RatedPower to precisely analyze financial KPIs, adjust project parameters, and optimize designs to achieve a positive NPV and a 10-year payback period, even with volatile energy prices. Watch tests of worst-case scenarios using four years of energy price data from Red Eléctrica Española, compare fixed PPA pricing to flexible hourly pricing, and refine designs to maximize returns with an IRR of up to 25%.
Case study 2: Germany
Did you know you can use RatedPower to run simulations using different land costs? This case study demonstrates how batch simulations with varying land costs can help developers achieve a higher IRR and refine designs under real-world constraints. See how to adjust pitch distances and ground cover ratios to identify the most profitable configurations as land prices increase.
Don’t leave your solar plant’s viability to chance
RatedPower gives you the tools you need to gain key financial insights and identify the most efficient designs to avoid costly mistakes.
Schedule a live demo to learn how to use our platform to streamline your analysis and unlock greater revenue potential.
FAQs
Will users be able to define an input for the energy selling price?
Users can define an energy selling price in u.m./MWh, and together with the energy injected into the grid, they can calculate revenue. This means users can gather more accurate revenue calculations to hone financial planning and profits.
Can we define operating costs by using a range of different measurement units over and above peak power?
The user can define several operating costs at once based on different units.
- u.m./MWdc/year
- u.m./MWac/year
- u.m./ha/year
- u.m/year
Users can build financial models with variable energy prices and hourly energy pricing to reflect actual market conditions. This is also available in our BESS arbitrage feature to maximize standalone and AC-coupled BESS performance.
What variables can I optimize in RatedPower?
You can optimize multiple variables simultaneously, including NPV, LCOE, and IRR. Depending on your priorities, you can focus on the variables most critical to your project’s success.
Can the graphs in RatedPower be exported as PDFs?
Not directly, but you can export your data to Excel and then create and save graphs as PDFs. We’re working on a feature that will allow you to generate reports with built-in graphs directly from RatedPower in the future. Stay tuned for updates.
Latest stories
Related posts
Technology and engineering
Learn PV substation engineering and design automation with RatedPower
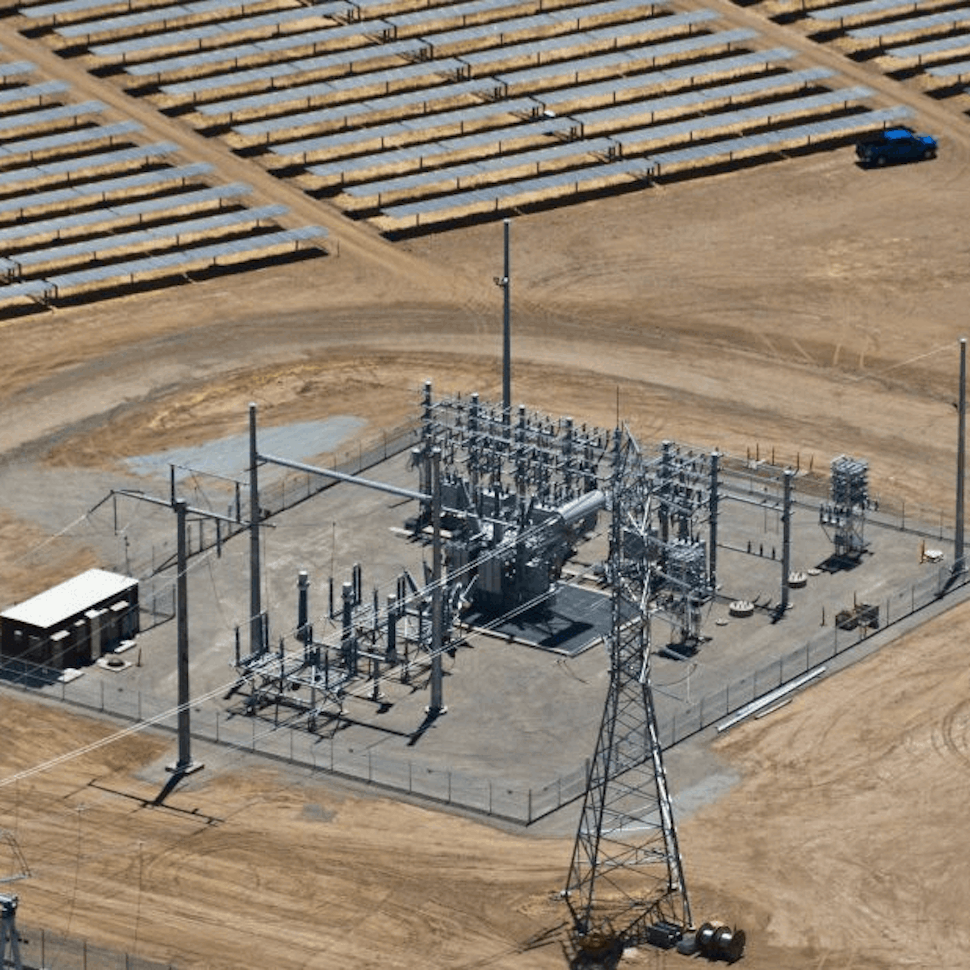
Do you know why and how a solar farm connects to the grid? RatedPower automatically generates the best solution for an interconnection facility and chooses between a switching and breaking station, a line to transformer substation or a single/double busbar substations.
Updated 2 DEC, 21


Market analysis
Breaking down solar farm costs: Free template inside
Updated 27 SEP, 21


Market analysis
Solar energy in Australia: a 2021 market analysis
Updated 11 MAY, 21