Watch a demo
India's 44.5 GW year: why deployment speed is raising the bar for design discipline
India's 44.5 GW year is reshaping solar project design. Lenders are raising the bar on documentation and traceability. Here's what that means for your project.



Content
India's record 44.5 GW renewable year is changing what solar project design has to deliver. As pipelines accelerate, lenders are scrutinizing the documentation trail more closely, and design discipline, traceable inputs, and consistency between simulation and the financial model have become bankability variables in their own right. Getting it right is now a competitive advantage.
India just had its biggest year for renewable energy on record. The country added 44.5 GW of renewable capacity in a single 12-month period. Solar alone jumped to 132.85 GW of cumulative installed capacity, with nearly 35 GW of that coming from new installations.
That's an extraordinary deployment rate. It's also a different kind of market environment for developers, engineering teams, and lenders to operate in. When a pipeline is moving this fast, the parts of the project that used to absorb friction quietly, design revisions, model updates, documentation sequencing, start to crack.
The pressure is already visible in delivery timelines. A recent Ember analysis found that utility-scale solar projects in India face an average delay of 17 months from their scheduled completion date, with some cases stretching to 34 months.

Land acquisition and transmission expansion are the headline causes, but beneath them lies a quieter problem: as deployment accelerates, the documentation discipline that financing depends on becomes harder to maintain, and projects that look strong on paper increasingly run into difficulty when the documentation trail reaches the lender review stage.
For anyone working on solar project design in India, that documentation discipline has quietly become a bankability variable in its own right.


Choosing the right dispatch strategy at the design stage is one of the highest-leverage decisions in this process. Battery energy storage system (BESS) dispatch behavior shapes your system's size, architecture, and bankability. To go deeper on how peak shaving, energy shifting, and arbitrage decisions affect those outcomes, watch our on-demand webinar with RatedPower's Principal Consultant Faten Driss.
The cost of velocity in a pipeline that's doubling
India's renewable rollout is touching nearly every part of the energy system simultaneously. Utility-scale solar continues to dominate the headline numbers, but hybrid systems combining solar with storage and behind-the-meter commercial and industrial installations are growing alongside it. The result is a mix of project types, each with its own load profile, dispatch requirement, and connection challenge.
For developers, this complexity arrives at the same time as deployment pressure. Projects move faster from feasibility to financial close. Design decisions are made in parallel rather than in sequence. Models get adjusted multiple times before lock-down. In a slower market, these are manageable. In India's current environment, they create traceability gaps that show up at the worst possible moment.
India's projects are not just fast and large. They're also increasingly won through aggressive competitive bidding, which leaves very little margin for cost overruns caused by design or modeling errors. When your tariff has been bid tight, a yield figure that turns out to be optimistic isn't just an engineering issue, it's a direct hit to project economics that can't be absorbed elsewhere.
The grid is under pressure, and so is the modeling
Adding capacity at India's current pace creates pressure points across the entire grid. According to the Central Electricity Authority's Long-Term National Resource Adequacy Plan, peak electricity demand grew at a compound annual rate of 7.06% between 2020 and 2025, and the IEA's Electricity 2026 report notes that regional and national peak loads in India are rising faster than average demand. Local congestion has become a meaningful variable in plant performance, particularly for projects sited in regions where multiple solar plants compete for the same connection capacity.
For a design engineer, that means yield assumptions can no longer be treated as static inputs. The system they model at feasibility is connecting into a grid that is materially different from the one their reference dataset was built on. Even modest changes to dispatch behavior, curtailment exposure, or peak-demand timing can shift the yield figure that ultimately enters the financial model.
This is a fast-moving environment, and standard hourly simulation often doesn't capture enough detail to support the subsequent financing process. Sub-hourly modeling gives engineering teams visibility into how the system actually performs under variable irradiance, when inverter limits are reached, and how those events relate to grid behavior. The output is a more defensible yield projection, and one that can be reproduced and traced when lenders ask.
When inputs drift, bankability suffers
It's a scenario that comes up more often than it should in fast-moving markets. Imagine the design team works with one irradiance dataset, while the financial model is built separately, using a slightly different yield estimate. Someone adjusts a figure to be conservative without updating the underlying simulation. A degradation rate gets entered manually into the financial model rather than pulled from the design tool. By the time documentation reaches lender review, the inputs no longer connect.
That's what assumption drift looks like in practice, and in a market like India where lender scrutiny is sharpening, it's becoming a leading cause of friction at financial close. The independent engineer, the third-party technical reviewer appointed by the lenders, will look for consistency between the design simulation and the yield figures in the financial model. When those don't match, the review slows down. The project doesn't necessarily fail, but it starts losing time, which, in a fast-moving market, is its own form of cost.

Modeling to the detail that lenders expect
Lender expectations in India have shifted alongside deployment. As more projects come through review, independent engineers have developed a sharper sense of where modeling assumptions tend to break down. Three areas in particular now attract scrutiny:
The temporal resolution of irradiance data. Lenders increasingly ask whether clipping loss assumptions are based on hourly averages or sub-hourly data, because the difference materially affects the P50 yield figure (the yield estimate expected to be met or exceeded in 50% of years).
The treatment of behind-the-meter and hybrid configurations. As more projects combine solar with storage, the dispatch logic and battery sizing assumptions need to be traceable to a defined operating strategy, not assumed.
The consistency between design outputs and the financial model. This is where assumption drift gets caught.
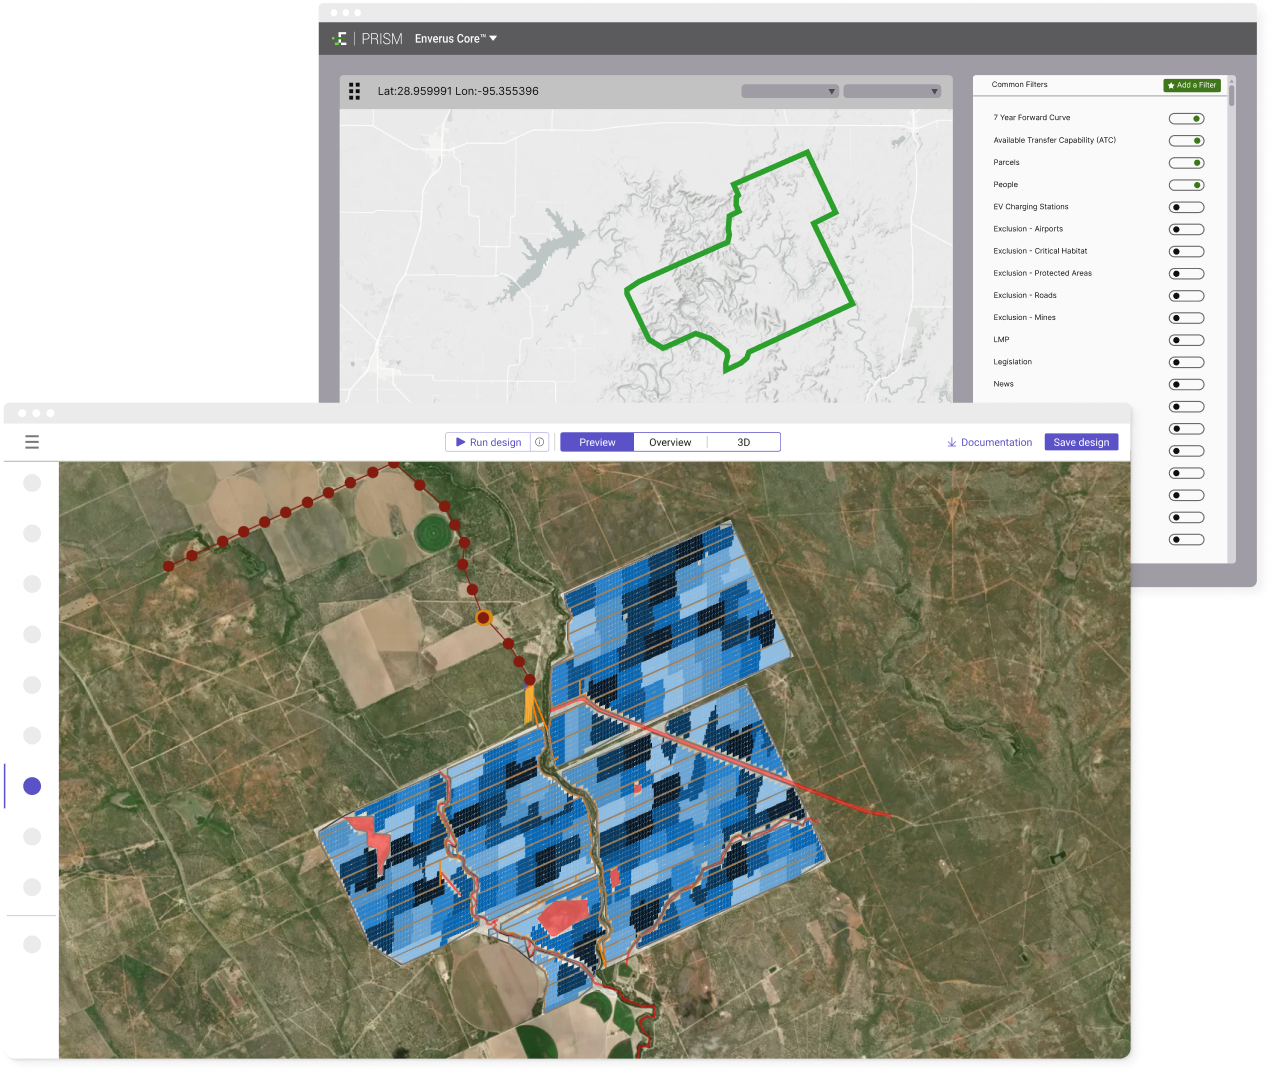
RatedPower is built around these three concerns. Design, simulation, and the inputs that feed the financial model are kept on the same dataset throughout. Sub-hourly resolution captures the intra-hour variability that hourly models miss. Battery dispatch can be configured at the design stage and tested against time-based pricing inputs, with the same outputs feeding directly into lifecycle and financial modeling, so the design and the financial case stay reconciled. The result is bankable solar design documentation that holds together under lender review because it was built coherently from the start.
If you're working through these questions on a hybrid project, the BESS dispatch strategies webinar walks through how dispatch logic and battery sizing decisions are made at the design stage in RatedPower.

Common questions on bankable solar design in India
What makes a solar project "bankable" in India's current market?
Bankability rests on a documentation trail that holds together under review. Lenders and their independent engineers look for consistency between the design simulation and the yield figures in the financial model. When deployment moves fast and inputs drift, that consistency is the first thing to break, and it is increasingly where projects lose time at financial close.
Why does sub-hourly modeling matter for Indian solar projects?
Standard hourly simulation can miss the intra-hour variability that determines clipping losses and real yield. Sub-hourly modeling captures how the system performs under variable irradiance and at inverter limits, producing a P50 figure that is more defensible and, critically, reproducible when an independent engineer asks how it was derived.
What is assumption drift, and how does it delay financial close?
Assumption drift is what happens when the design simulation and the financial model stop sharing the same inputs: a degradation rate entered manually, a yield figure adjusted to be conservative without re-running the model. By lender review the numbers no longer reconcile, the review slows, and the project loses time it cannot easily recover in a fast-moving pipeline.
From warp-speed deployment to investable design
The opportunity in India is real. The pipeline is substantial, the policy environment is supportive, and the demand fundamentals are strong. The constraint is execution, and increasingly, execution means the ability to move quickly without losing the documentation discipline that financing depends on.
Developers who treat design and modeling as a continuous process, with the same inputs flowing from feasibility to financial close, will close projects faster. Those who treat them as separate exercises will spend more time in lender review, more time answering questions about why the numbers don't match, and more time chasing alignment that should have been built in from the start.
2026 Trends: Renewable Energy & Solar Research Report
Download our latest report to gather insights, stats, and opinions on the current state of the renewables sector. The report draws from an industry survey and analysis of solar simulations carried out on the RatedPower Platform.


Latest stories
Related posts
Market analysis
DACH BESS: shield solar revenue from negative prices
Explore how BESS can help German solar developers manage negative-price exposure, and compare early-stage PV-plus-storage designs with RatedPower.
Updated 22 SEP, 26


Market analysis
Curtailment is now a design constraint in Iberia: here's why
Solar curtailment in Spain is now a design constraint. Download RatedPower's Iberia curtailment playbook and model PV and BESS layouts before you build.
Updated 8 SEP, 26


Market analysis
Why grid-aware design is now critical for solar and BESS project economics in Australia
Grid constraints now shape BESS project development in Australia. Download RatedPower's BESS Design Handbook for a full sizing and dispatch framework.
Updated 1 SEP, 26