Watch a demo
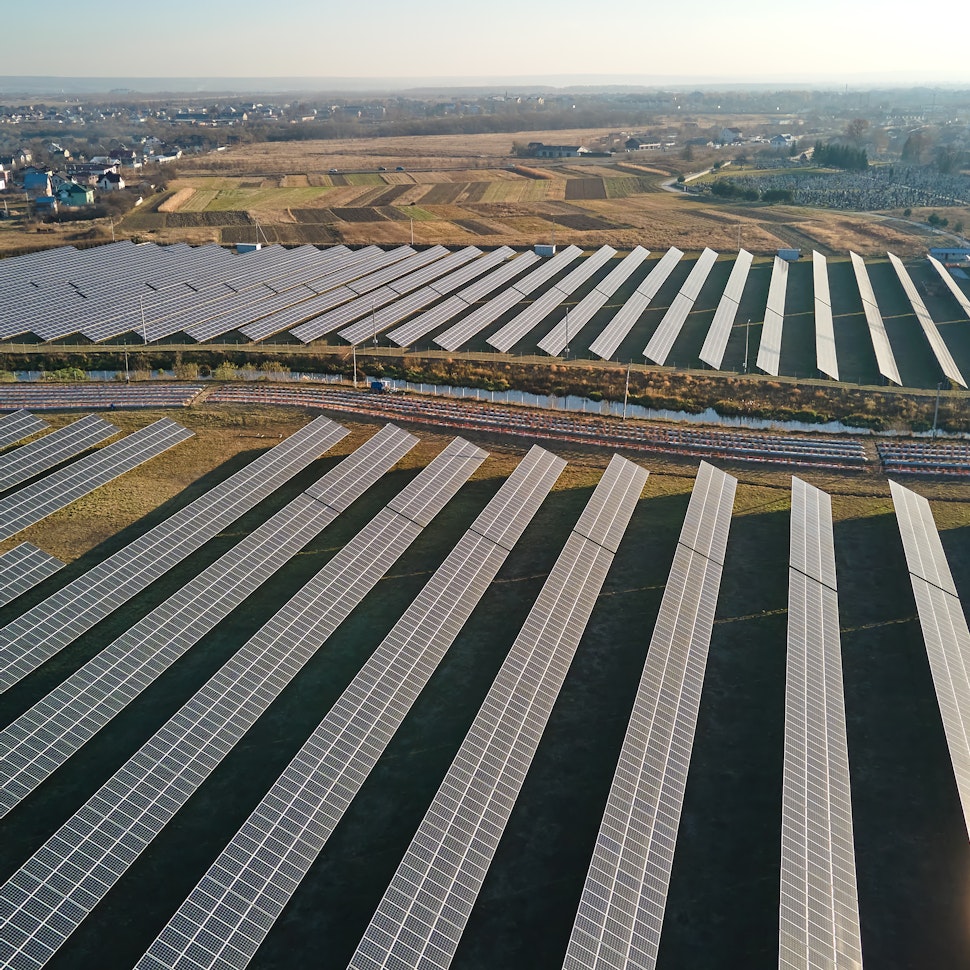
Nordic BESS: from ancillary services to arbitrage
Nordic BESS revenues are compressing as FCR saturates. See how arbitrage and AC/DC coupling design shape the merchant revenue you can actually capture.


Laura Rodríguez
Territory Manager Oceania & Nordics
Laura is a renewable and software industry sales professional, currently working at RatedPower as Territory Manager Oceania & Nordics. With a background in International Business and International Trade, Laura previously worked in the business strategy area in various companies as well as as a market analyst for the Government of Spain in Australia.

Content
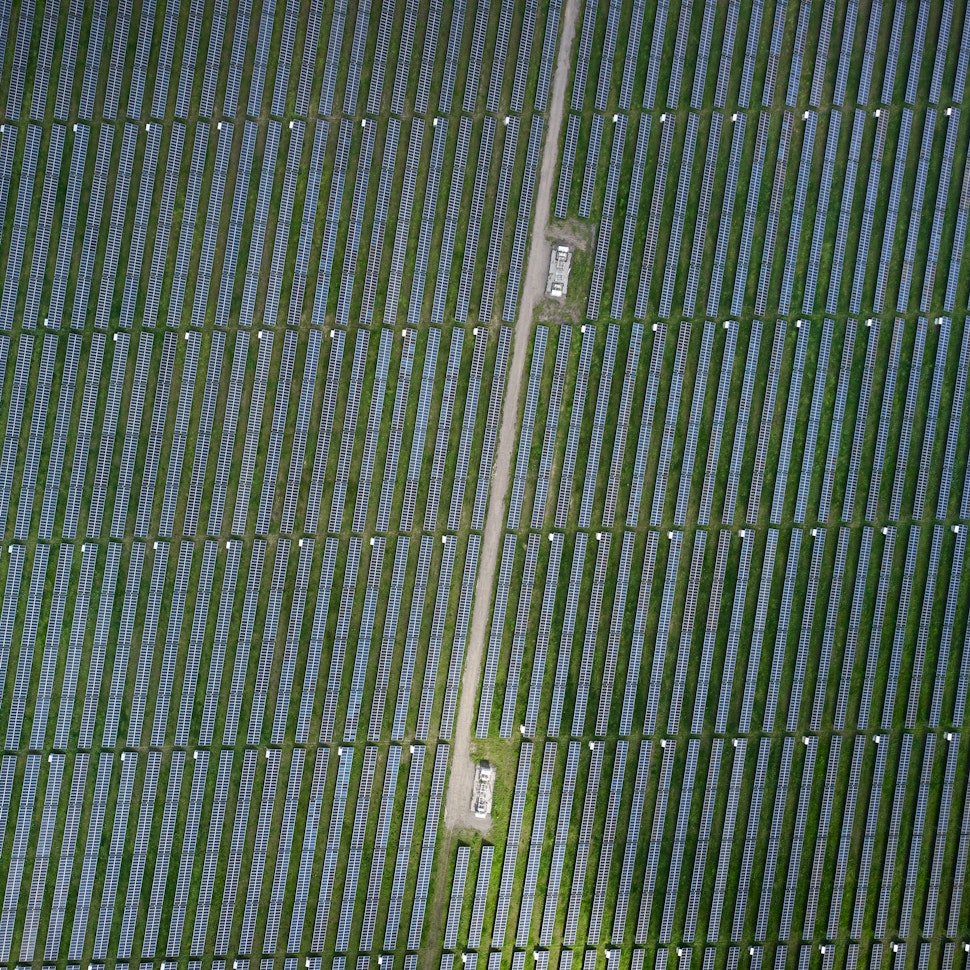
Nordic battery revenues have leaned on frequency services like frequency containment reserve (FCR), but that market is filling up fast. Developers can defend returns by building arbitrage and merchant trading into the revenue mix. The design choices made early, alternating current (AC) or direct current (DC) coupling and how you size the battery against the export limit, shape how much of that arbitrage a plant can actually capture.
Finland recorded 754 negative-price hours in the most recent 12-month dataset, and Sweden came in close behind at 649, both of which are among Europe’s highest. Even with all those dips, daily highs stayed close to the floor: just €77/MWh in Finland and €58/MWh in Sweden.
With prices compressed that tightly, it is no surprise that arbitrage has taken a back seat. Storage projects lean instead on FCR, which still pays well. The question is how long that holds.
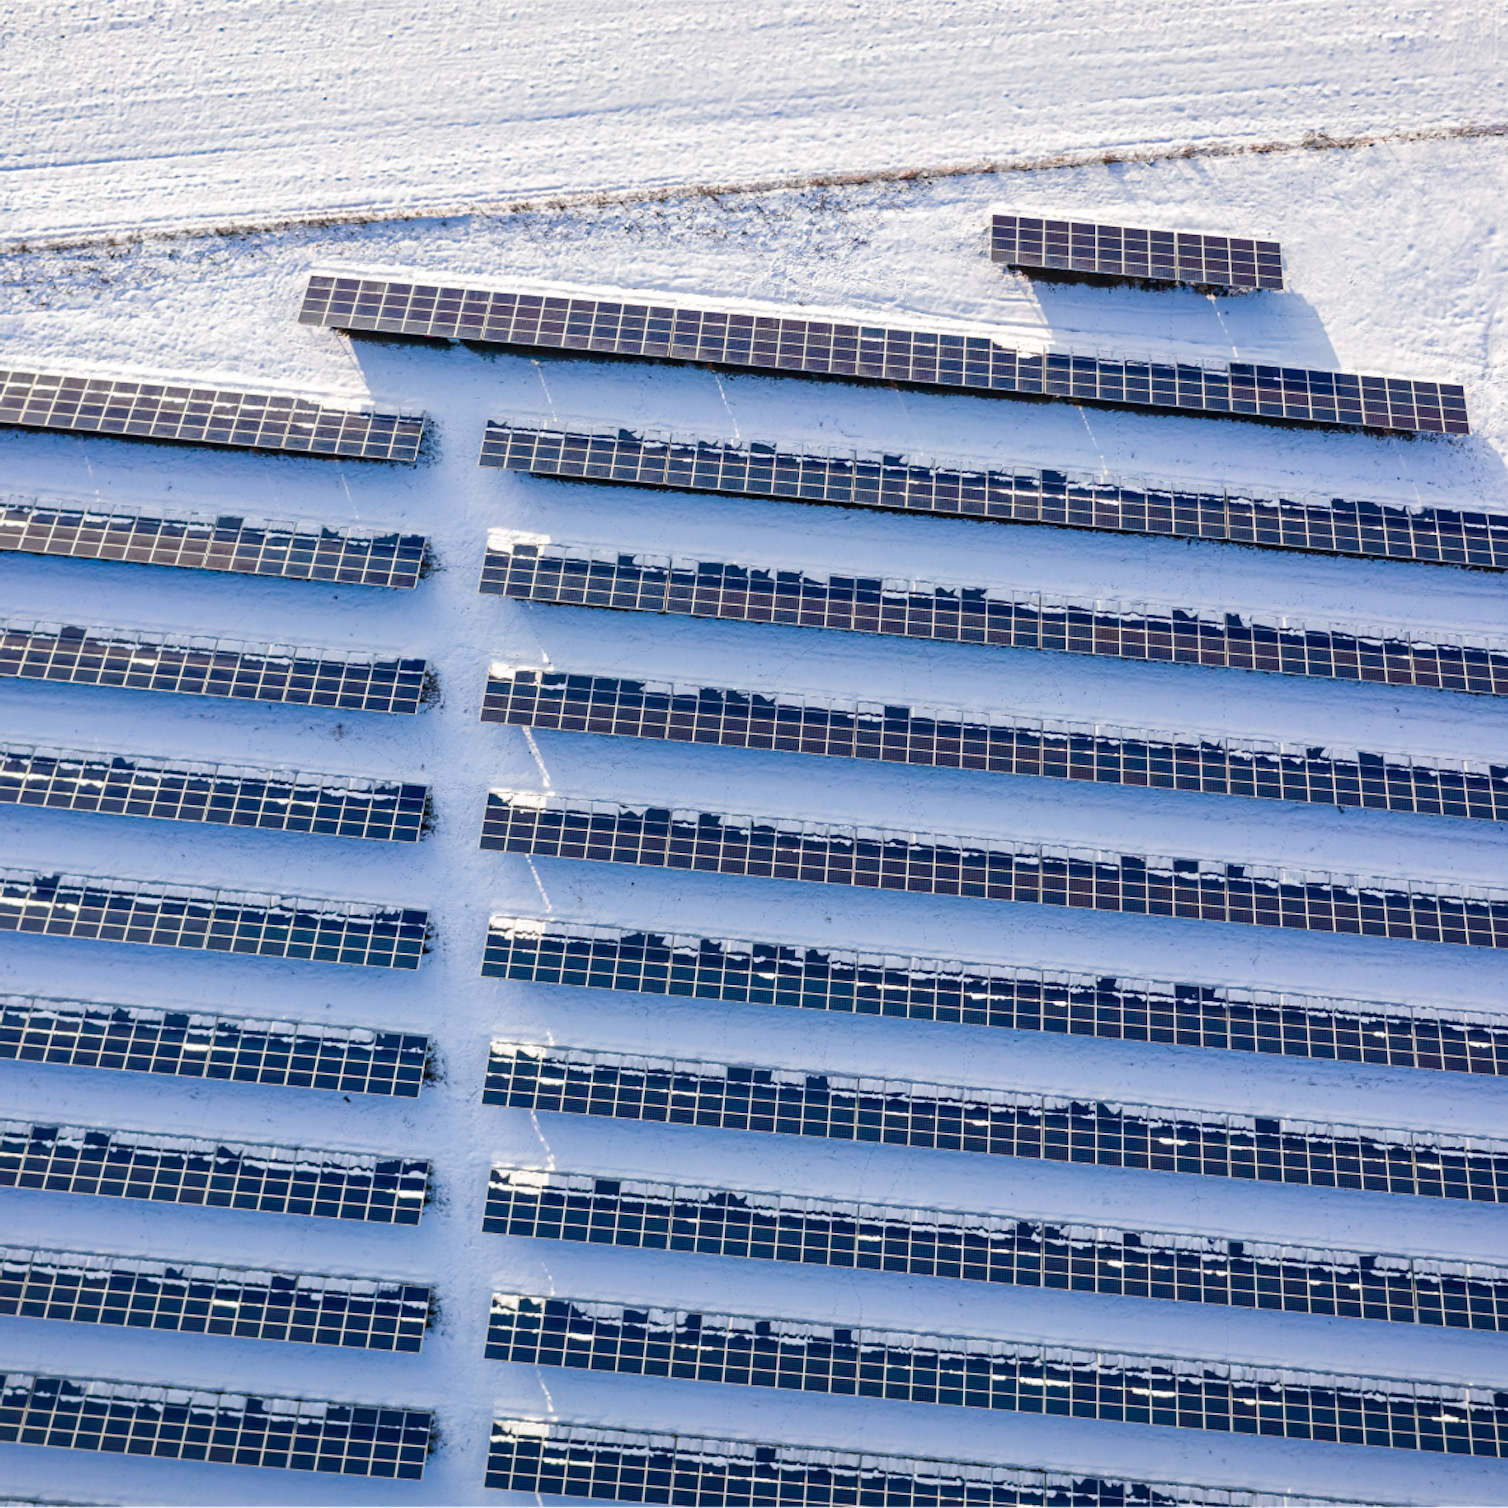
The market is changing
Batteries are being built across the Nordics much faster than the frequency market can absorb them. Saturation may not be far off.
Australia has been here before. Ancillary earnings during its first BESS boom looked durable, then new buildouts overwhelmed the frequency control ancillary services (FCAS) market and pushed revenues down 61% in a matter of weeks. The recent rise in extreme imbalance prices and record negative-price events in the Nordics points the same direction. (For the full parallel, see our analysis of how Australia’s BESS market handled ancillary saturation.)
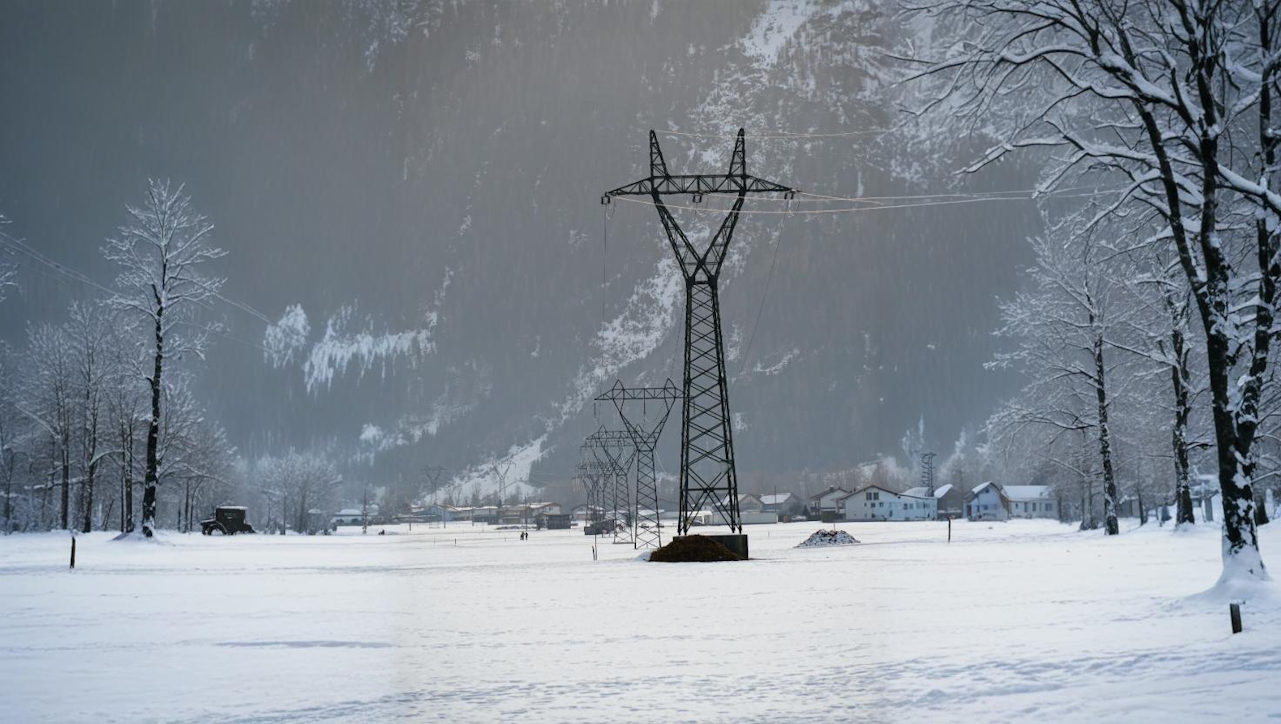
More renewables keep coming online, but the power cannot always reach the regions that need it, and large industrial loads add further strain. Those pressures are widening across both location and time, which is exactly what makes arbitrage more attractive. The same congestion dynamics are already evident in our analysis of grid bottlenecks in the region.
Related reading: grid congestion in the Nordics.
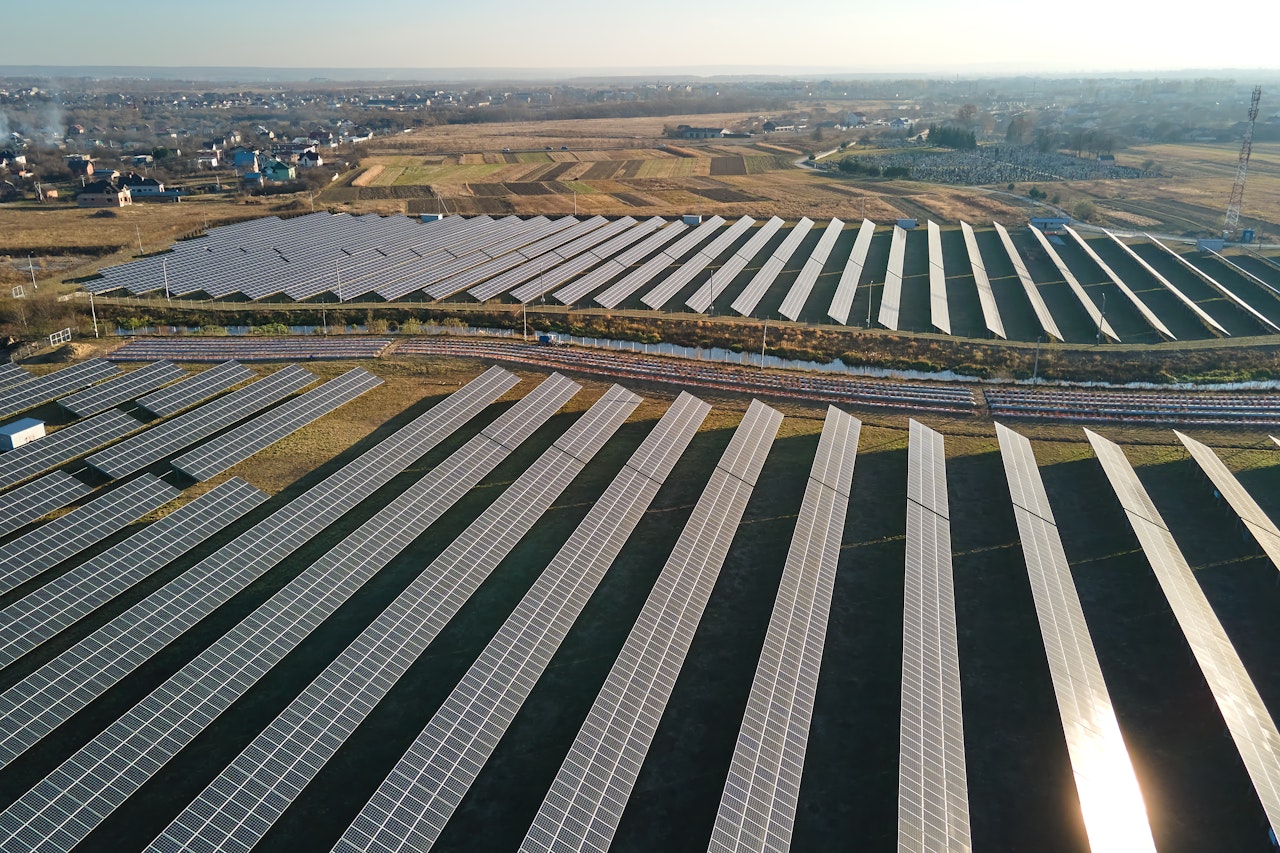
AC versus DC: why coupling architecture matters more than ever
Arbitrage in the Nordics will not be a tidy matter of charging low and discharging high on a predictable daily curve. The Nordic market, like much of Europe, now settles every 15 minutes. Whether a battery can respond in time to capture those short price windows largely depends on its coupling architecture.
DC coupling works best during high-irradiation periods when there is excess solar to capture. Because the battery connects on the DC side, it charges directly from the array without first converting to AC, capturing clipped energy that a saturated inverter would otherwise waste. It also skips a conversion step, which trims efficiency losses, and it absorbs surplus generation through long sunny stretches.
The trade-off is that solar and storage share a single inverter and a single grid export limit in most DC-coupled designs, so their combined AC output cannot exceed that ceiling at any given moment.
AC coupling removes that constraint. The battery does not share an inverter or export path with the PV array, so its output is not capped by whatever the solar side is producing at the time.
That independence can be worth a lot in a market that does not follow a steady sunny-day rhythm. Nordic system supply swings between windy oversupply and hydro-limited scarcity, so dispatch flexibility tends to earn more than incremental PV efficiency. Our deeper comparison between AC- and DC-coupled BESS walks through the engineering trade-offs in detail.
RatedPower lets you iterate AC and DC coupling configurations under the same plant assumptions, such as PV production profile and export limits, so you can see how each topology affects technical flexibility before running detailed financial modeling.
Sorting through coupling options and want to see how they affect your project’s financials? This webinar will help you get oriented.

How much flexibility is actually left over?
After you account for contractual constraints, such as fixed discharge windows and state-of-charge buffers, how much usable capacity remains in your design?
RatedPower helps you quantify the technical limits that shape that flexibility by showing:
How inverter sizing and export limits shape system output at the point of interconnection
Where clipping may occur in DC-coupled designs
How AC and DC topologies differ in shared infrastructure
This visibility helps avoid a common pitfall: committing more capacity on paper than the system can technically deliver under its design constraints.
Can you demonstrate what capacity your design can support?
Regulators and lenders increasingly expect developers to clearly show how energy flows through hybrid systems, including how PV generation and battery discharge are represented in the design.
If that separation is not clearly reflected in your design assumptions and outputs, certain revenue streams may be harder to justify, and financial models may come under greater scrutiny.
RatedPower supports this level of transparency by generating:
Export-limit assumptions embedded in the electrical design
Factoring in real generation profiles and OEM constraints
Account for BESS cooling energy use for more accurate yield and financial results.
This helps ensure that commercial assumptions are grounded in a documented and traceable system design.

Making the call on the KPIs
You can engineer a plant that works perfectly on paper and still end up with a weak investment. In many cases, this is because financial models assume the battery operates exactly as planned. In reality, hardware constraints and system design limits shape what the asset can deliver, while market timing adds further uncertainty.
RatedPower’s financial outputs allow you to evaluate how different plant configurations perform by combining capital expenditure (CapEx), expected yield, and your revenue assumptions.
You can compare:
How different configurations perform over the project lifetime.
How long it takes to recover the upfront investment.
Whether the projected returns meet your internal thresholds.
It also shows how design inputs feed into those results: coupling architecture, inverter sizing, export limits, and user-defined operating assumptions all influence the financial KPIs you are comparing.
This allows you to compare configurations on a like-for-like basis before final structuring, while there is still time to adjust the design and refine your revenue assumptions.
Schedule a demo to see how your coupling and hybrid design choices impact the financial outcomes.
2026 Trends: Renewable Energy & Solar Research Report
Download our latest report to gather insights, stats, and opinions on the current state of the renewables sector. The report draws from an industry survey and analysis of solar simulations carried out on the RatedPower Platform.


Latest stories
Related posts
Market analysis
Türkiye's solar boom is outpacing its grid: what that means for project design
Türkiye doubled its solar capacity in 30 months and has 14.6 GW more coming. Here's how to design solar projects that hold up when grid constraints and clipping compound.
Updated 14 JUL, 26


Market analysis
Iberia's BESS price curve explained: What 2026 means for developers
Find out how RatedPower helps Iberian solar developers evaluate battery storage costs accurately from day one, using real equipment data and site-specific design.
Updated 23 JUN, 26


Market analysis
Red tape vs. renewable goals: How Solarpaket II aims to unblock Germany’s solar future
Discover what derailed Germany’s solar rollout under Solarpaket I, and how Solarpaket II aims to cut red tape, boost incentives, and unlock energy-sharing models.
Updated 18 JUN, 26