Watch a demo
Türkiye's solar boom is outpacing its grid: what that means for project design
Türkiye doubled its solar capacity in 30 months and has 14.6 GW more coming. Here's how to design solar projects that hold up when grid constraints and clipping compound.


Content
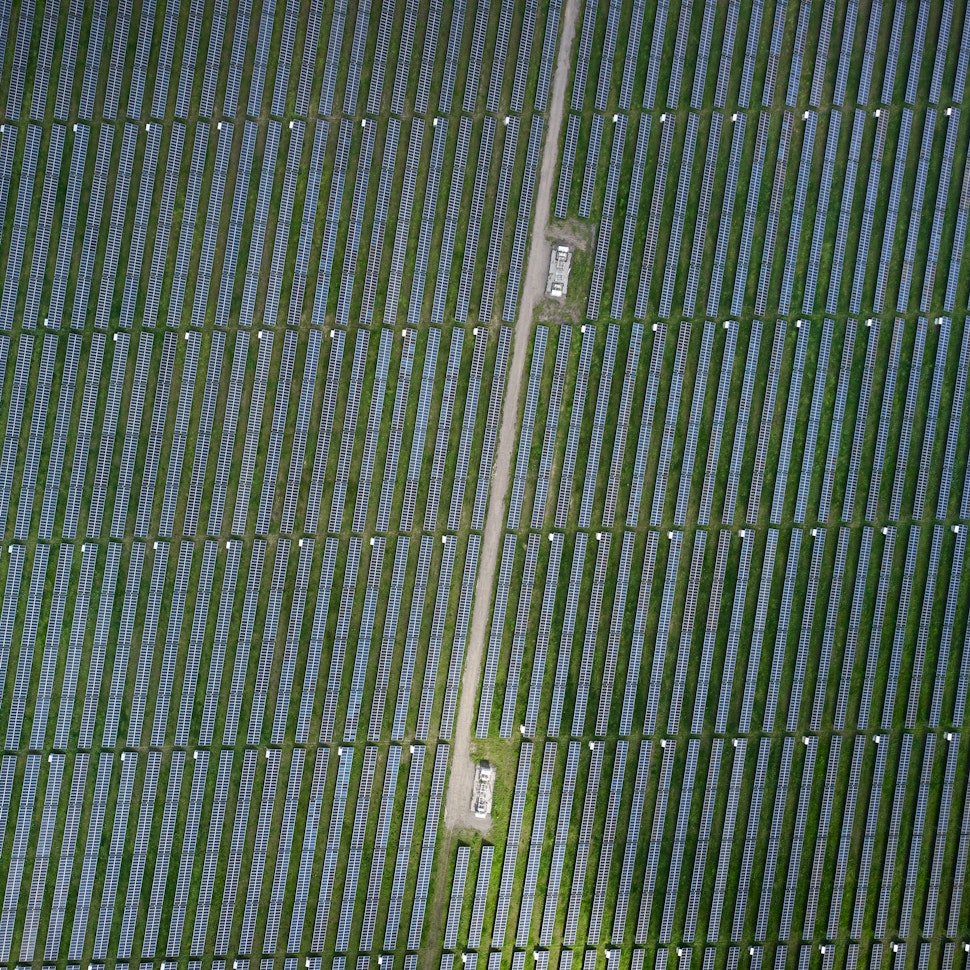
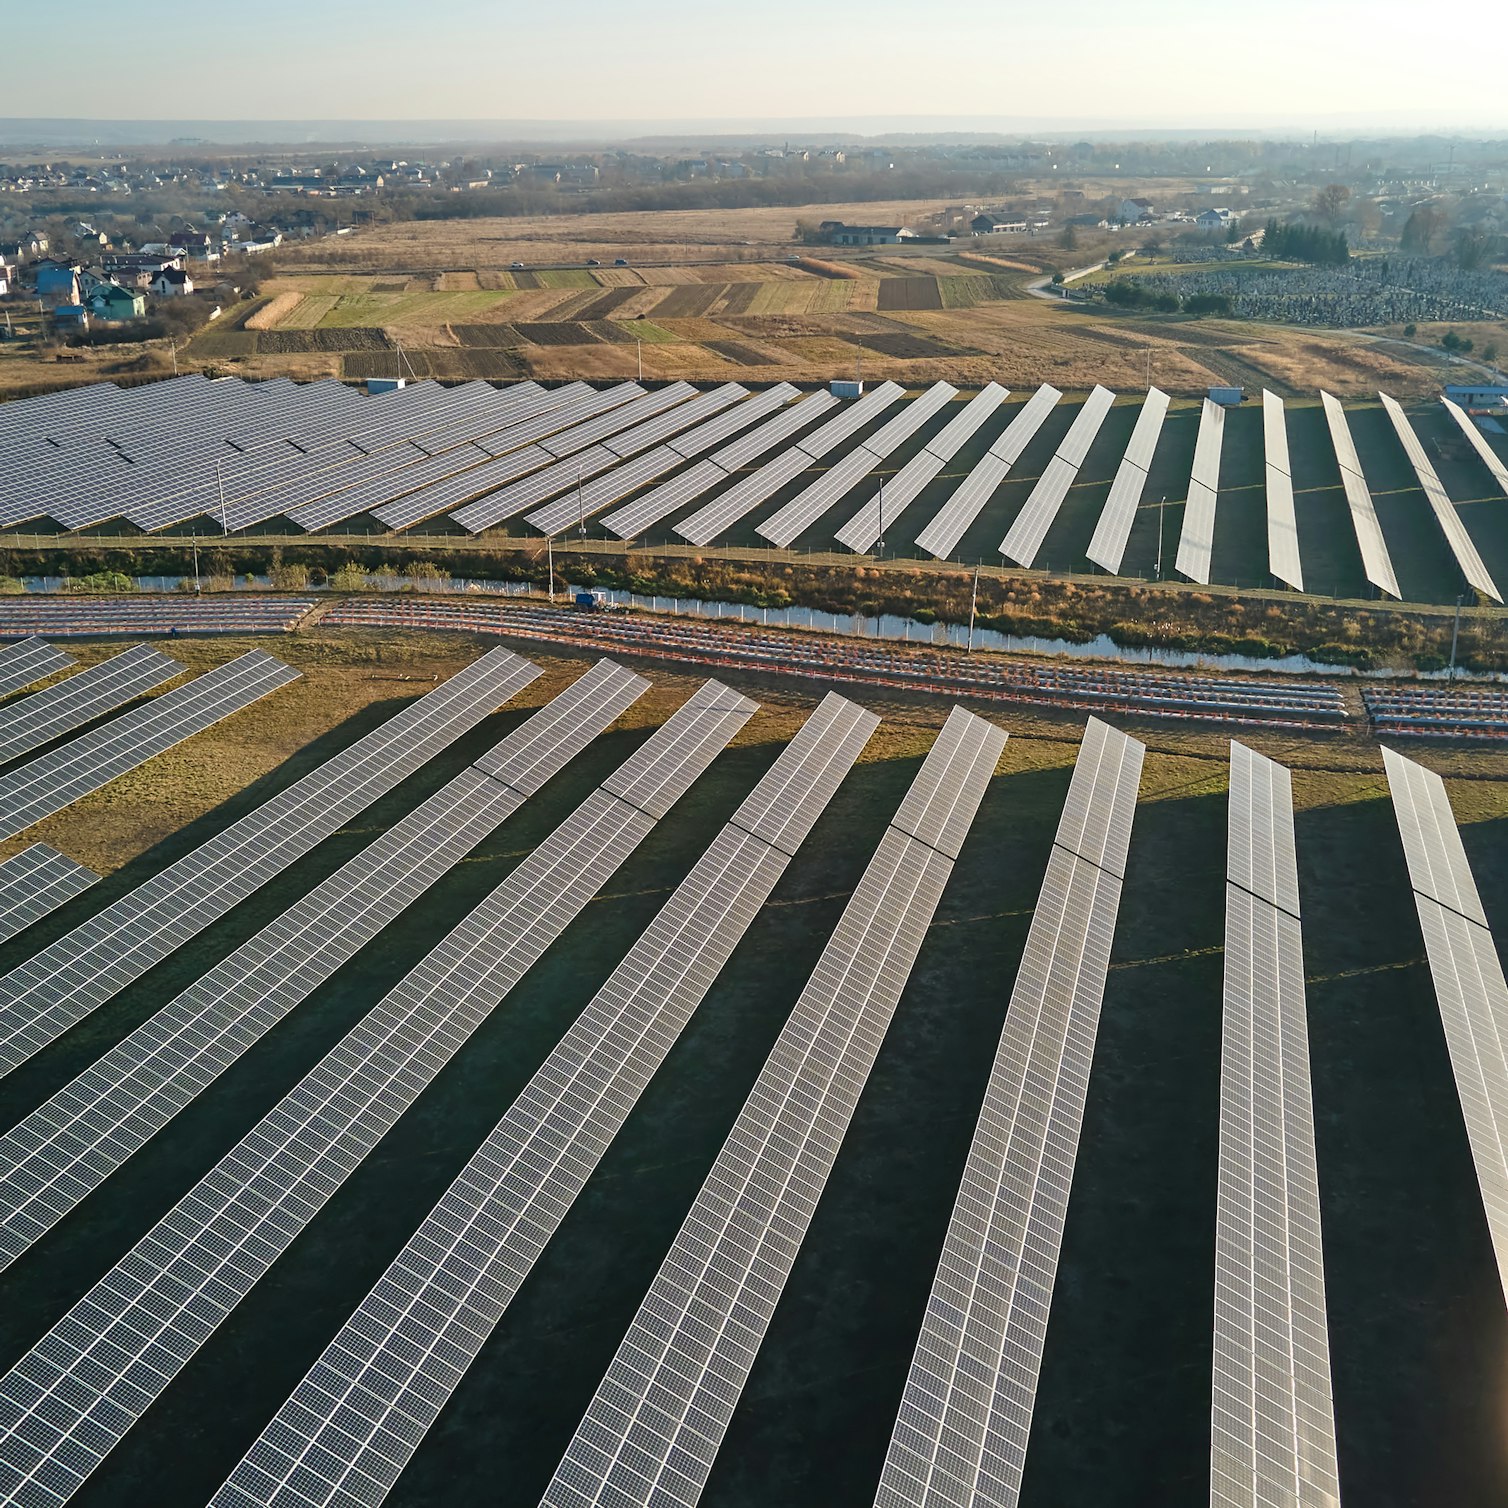
Türkiye didn't just meet its solar targets; it exceeded them. It doubled its installed solar capacity in two and a half years and left national planning projections behind. Analysts expect the next wave to be even more aggressive, with 14.6 GW of solar paired with storage set to come online over the next five years.
That's a remarkable deployment story. It also creates a problem that fast-moving markets tend to generate: generation capacity is scaling faster than the grid infrastructure needed to absorb it.
In that environment, risk doesn't disappear. It relocates. It moves out of the procurement process and into the design stage, where grid curtailment collides with inverter clipping losses, and many standard modeling tools underestimate both. For developers working on solar project design in Türkiye, that distinction has become a financing question, not just an engineering one. Understanding these risks is what separates developers who will finance successfully from those who will face difficult conversations down the line.
Choosing the wrong dispatch strategy at the design stage is expensive to fix later. In this webinar, RatedPower's Principal Consultant Faten Driss breaks down peak shaving, energy shifting, and arbitrage, and how each decision shapes your system's size, power rating, and architecture. Learn how to configure dispatch rules in RatedPower and compare strategies with confidence. Watch the 45-minute on-demand webinar now.
When buildout outpaces absorption: the curtailment problem
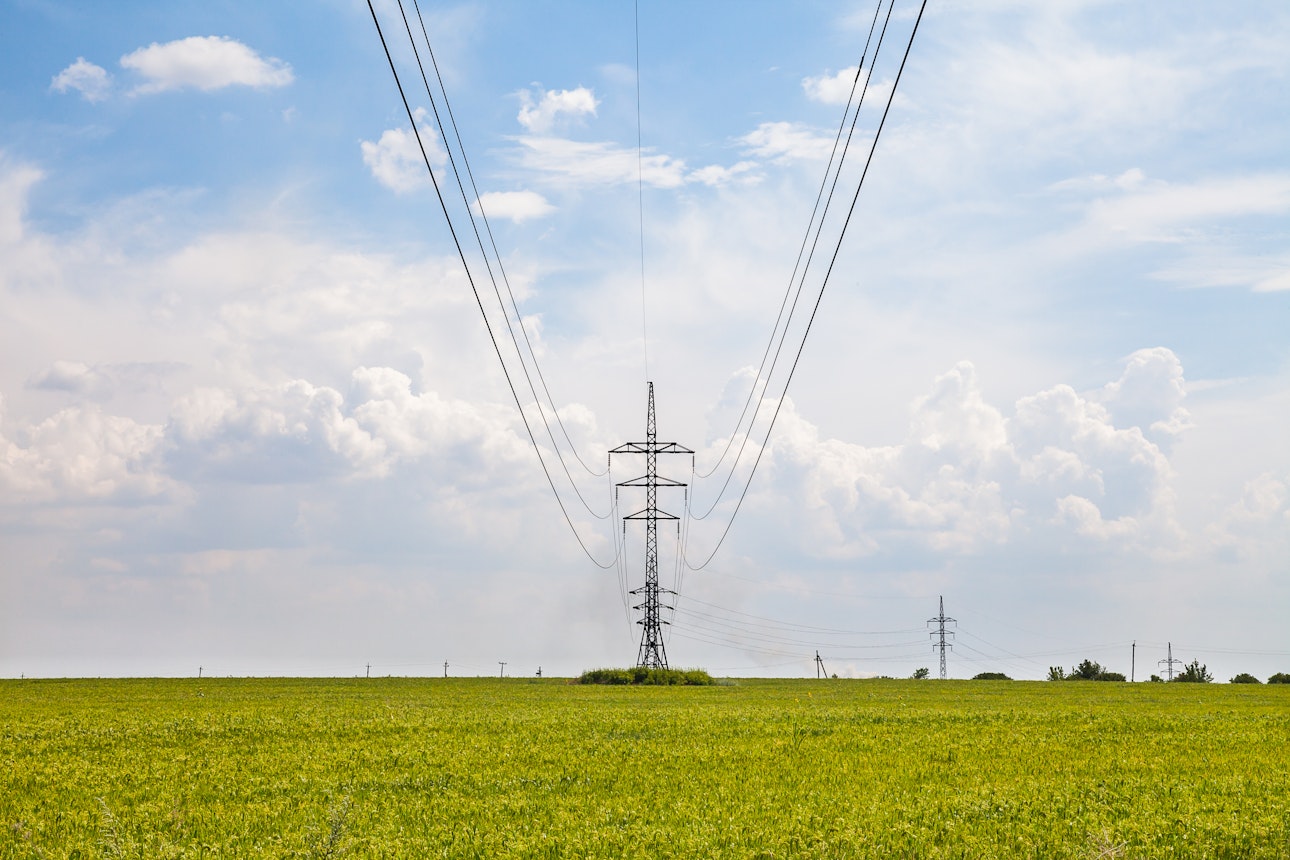
Grid infrastructure takes longer to build than solar capacity. Connection assets, transmission upgrades, and substation expansions all operate on different planning and permitting timelines than the generation projects they serve. In markets where solar deployment has been rapid and regionally concentrated, the gap between installed generation and the grid's ability to carry it creates curtailment risk.
Curtailment means your system generates power that the grid cannot accept. The generation happens, the losses are real, but the revenue isn't there. For a project developer, curtailment events are particularly difficult to model because they're not uniformly distributed across the year. They cluster around periods of high irradiance, when generation across a region peaks simultaneously and competes for limited grid capacity.
That clustering matters for design. It means curtailment exposure isn't just a volume problem. It's a timing problem. And it interacts directly with another loss mechanism that peaks at exactly the same moments.

Clipping losses compound in a constrained grid
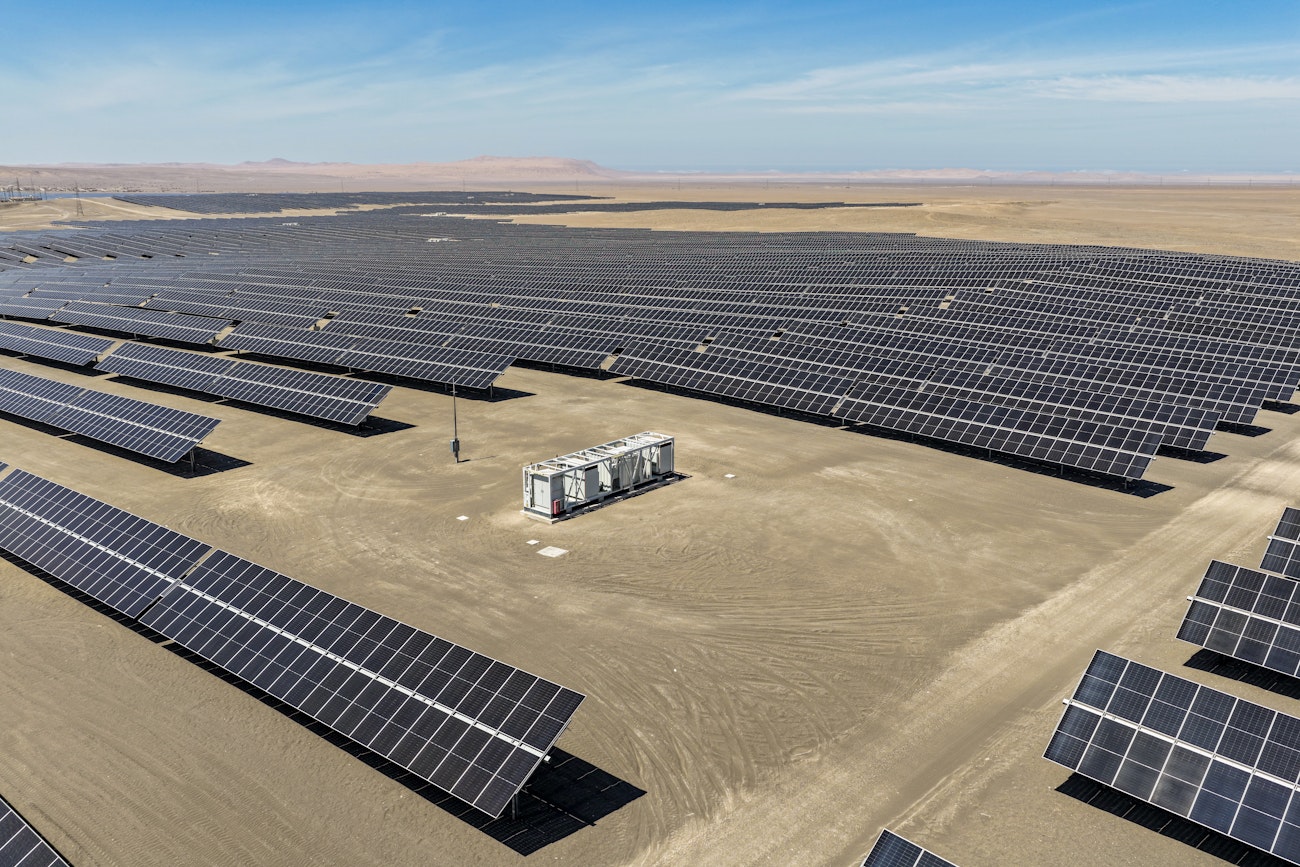
Clipping happens at the inverter level. When the solar array produces more power than the inverter can feed to the grid, the inverter caps its output, and the excess is wasted. It doesn't happen all day; it happens in short bursts during the brightest parts of the day when irradiance spikes above the inverter's limit.
Here's why that matters specifically in Türkiye: those same bright windows are when grid congestion is most likely. Every generator in the region is producing at peak simultaneously, competing for the same grid capacity. So in a single high-irradiance hour, you can be losing energy at the inverter through clipping and losing revenue at the grid connection through curtailment at the same time.
Many performance models don't catch this. Standard hourly datasets average out those irradiance spikes, so the model shows steady, uninterrupted output. In reality, the system is clipping for several minutes every bright hour. The yield figure in the financial model might already be too high before curtailment is applied. Stack the two errors, and the gap between projected and actual revenue becomes material.
RatedPower's sub-hourly modeling addresses the first problem by operating at a finer time resolution. Instead of hourly averages, it captures those irradiance spikes and shows you exactly when your system hits inverter limits and how often. That gives you a yield baseline you can trust, so when you do apply curtailment assumptions, you're building on accurate foundations rather than compounding one error on top of another.
The DC-to-AC sizing decision in a constrained market
The DC-to-AC ratio is where curtailment risk and clipping losses converge into a single design decision, and it's where the stakes are highest in a grid-constrained market.
In an unconstrained market, higher DC overcapacity means more generation but more clipping. You compare configurations, weigh the tradeoff, and choose. In a constrained market, higher DC overcapacity means more clipping at the inverter level and, simultaneously, more generation pushed into the periods when the grid is most congested. The two downside risks move together.

This means the standard unconstrained framing of the DC-to-AC decision can actively mislead you. A ratio that looks optimal under normal modeling assumptions can look materially different when intra-hour clipping behavior and curtailment timing are both visible.
With sub-hourly resolution in RatedPower, you can run configurations against site-specific irradiance profiles and observe how each scenario performs across the full distribution of irradiance conditions, including the peak events where both risks are most pronounced. The output is a sizing decision based on evidence rather than averaged assumptions, which is a different kind of answer to take into a lender conversation.
If you're evaluating battery sizing alongside inverter configuration, RatedPower's eBook walks you through the full sizing process. covering the services your system needs to provide, how to model profitability, and how to meet tender requirements. Includes a real project case study. Download the BESS sizing guide and take the guesswork out of your next feasibility study.
What an independent engineer will ask
Technical due diligence in high-buildout markets has sharpened. Independent engineers reviewing projects in Türkiye are asking pointed questions that standard hourly modeling often can't answer cleanly: how curtailment risk has been quantified, whether clipping loss estimates account for intra-hour irradiance variability, and whether the yield figure in the financial model is traceable to the same assumptions used in design.
It's a scenario that comes up more often than it should. Imagine the design team works with one irradiance dataset, while the financial model is built separately using a different yield estimate. Someone adjusts a figure to be conservative without updating the underlying simulation. By the time the documentation reaches lender review, the inputs no longer connect. In a market where the independent engineer already has reason to probe curtailment exposure, that kind of inconsistency accelerates scrutiny rather than deflecting it.
RatedPower keeps performance simulation and design on the same input set from the start. When the independent engineer asks where the P50 yield figure comes from, the answer points to the same simulation that generated the bankable solar design, with a temporal resolution that shows how clipping and production variability were handled. That traceability is not a bureaucratic nicety in a market like Türkiye. It's the difference between a smooth due diligence process and one that stalls.
Building for a market that moves fast
Türkiye's pipeline is substantial, and the fundamentals are strong. The developers who perform well in it will be the ones who treat grid constraints as a design input, not an operational footnote, and who have the modeling evidence to support that position when lenders ask.
DC-to-AC ratio, battery sizing, inverter capacity, and dispatch timing all interact. In a market where clipping and curtailment compound, pressure-testing those interactions at the design stage costs far less than addressing them after review.
To see how a battery energy storage system (BESS) dispatch strategies work in practice, including peak shaving (reducing maximum load), energy shifting (storing energy for later use), and arbitrage (buying and selling energy for profit), watch our on-demand webinar: BESS dispatch strategies explained.
2026 Trends: Renewable Energy & Solar Research Report
Download our latest report to gather insights, stats, and opinions on the current state of the renewables sector. The report draws from an industry survey and analysis of solar simulations carried out on the RatedPower Platform.


Latest stories
Related posts
Market analysis
Nordic BESS: from ancillary services to arbitrage
Nordic BESS revenues are compressing as FCR saturates. See how arbitrage and AC/DC coupling design shape the merchant revenue you can actually capture.
Updated 30 JUN, 26


Market analysis
Iberia's BESS price curve explained: What 2026 means for developers
Find out how RatedPower helps Iberian solar developers evaluate battery storage costs accurately from day one, using real equipment data and site-specific design.
Updated 23 JUN, 26


Market analysis
Red tape vs. renewable goals: How Solarpaket II aims to unblock Germany’s solar future
Discover what derailed Germany’s solar rollout under Solarpaket I, and how Solarpaket II aims to cut red tape, boost incentives, and unlock energy-sharing models.
Updated 18 JUN, 26